Marvel vs DC Films: A Visual Analysis
December 13, 2018
With a new Marvel or DC film hitting cinemas nearly every few months, comic book nerds are no longer the only ones with opinions on the age-old rivalry between Marvel and DC. But what does the cold, hard data have to reveal about this debate?
Box office battle
There are a lot of ways we could compare the film success between the two comic book publishers, but let’s start with the most obvious: box office gross. It’s helpful to look not just at how much money the films made, but at how much money they cost too.
Higher budget films usually earn more at the box office, with some notable exceptions and standouts:
Earth’s Mightiest Films
Avengers: Infinity War (Marvel, 2018) was a clear standout, achieving the highest box office gross overall, while also being given the highest budget. In fact, among all Marvel and DC films, the top five highest grossing movies were the three Avengers films, followed by two other Marvel films, namely, Black Panther (Marvel, 2018) and Iron Man 3 (Marvel, 2013).
The World’s Greatest Box Office Bomb
In contrast, while Justice League (DC, 2017) cost almost the same as Avengers: Infinity War to produce, but earned barely a third of the box office gross.
The Merc with the Money
Even the low budget miracle that is Deadpool (Marvel, 2016) managed to earn 22% more than Justice League, with less than 20% of the DC film’s budget. That’s a huge improvement over Ryan Reynold’s DC foray, Green Lantern (DC, 2011), which was the lowest grossing film among those with an above-average budget.
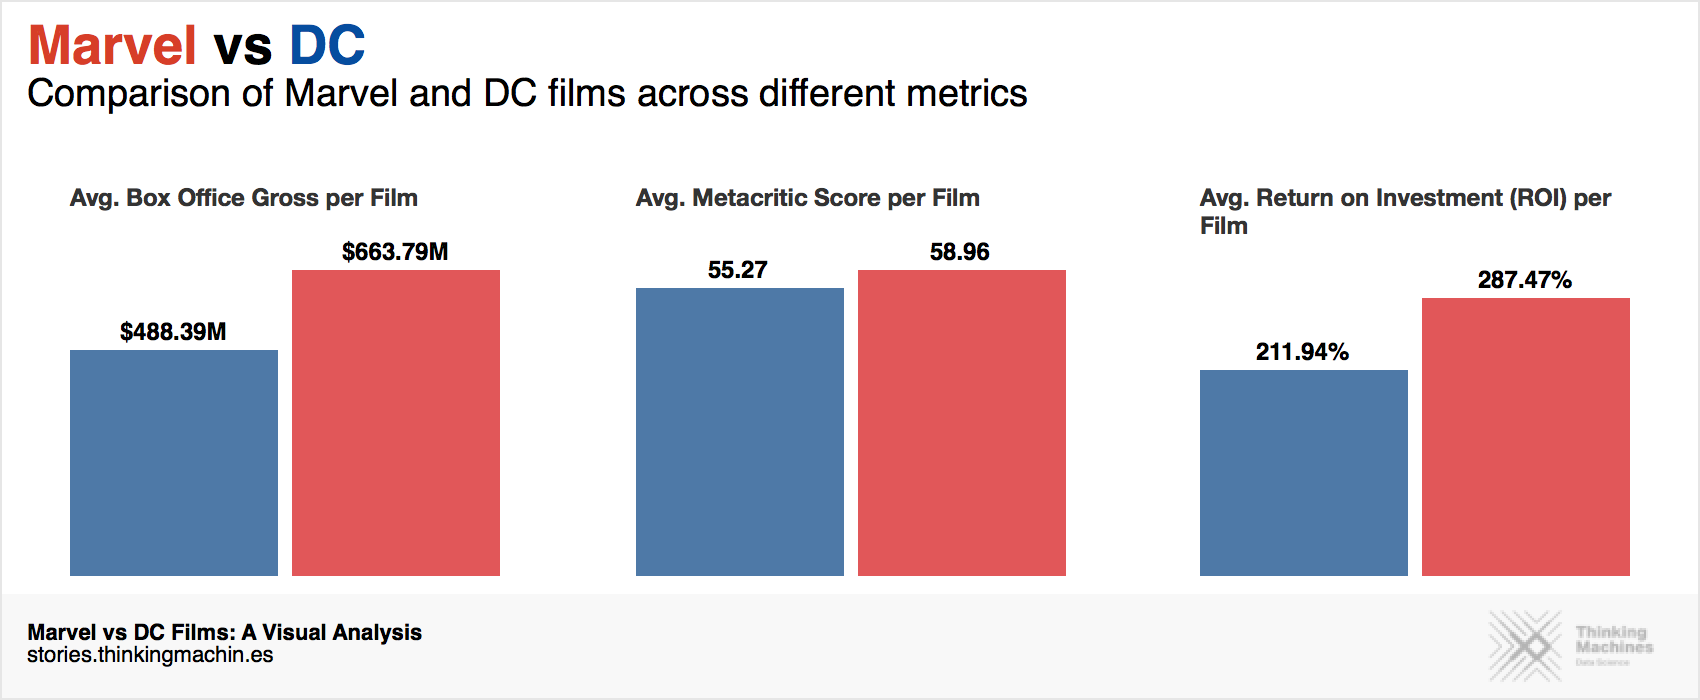
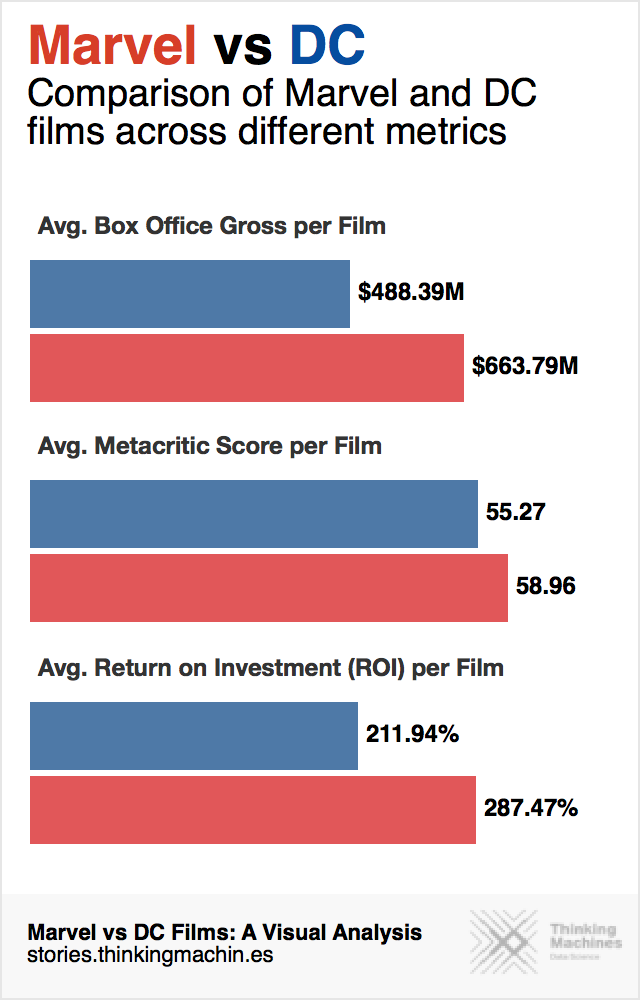
Overall, Marvel movies grossed on average 36% higher than DC films, while only spending 6% more creating them.
Does popularity = quality?
Marvel films definitely earn more than DC films. But are popular movies necessarily better? Let’s plot the correlation between the films’ box office gross and Metacritic scores.
Loved by Critics and Crowds
Out of all the films, Black Panther (Marvel, 2018) achieved the highest Metacritic score. We can see it in the upper right quadrant among other movies that had above average ticket sales and critic ratings. Nineteen percent of Marvel films can be found in this quadrant, but in contrast only three percent of DC films made the cut: The Dark Knight (DC, 2008), The Dark Knight Rises (DC, 2012), Wonder Woman (DC, 2017), Batman (DC, 1989) and Superman (DC, 1978).
Critically-Loved Box-Office Duds
In the bottom right quadrant, we see the movies that got high scores from critics but low box office turnout. A number of DC films fell into this quadrant, such as The Lego Batman Movie (DC, 2018), Teen Titans Go! To the Movies (DC, 2018), and Superman II (DC, 1980), which had the second highest Metacritic score among all films listed.
Disliked by All
The bottom left quadrant is home to movies that both critics and consumers would agree were pretty bad. Four out of the five lowest-rated movies came from DC, including Catwoman (DC, 2004) and the bottom of the barrel Supergirl (DC, 1984). Meanwhile, Fantastic Four (Marvel, 2015) was Marvel’s lowest-rated film.
Crowd-Pleasing Critical Stinkers
The last quadrant on the upper left is for the movies that did well in the box office but were critically unremarkable. There aren’t many movies in this quadrant, but the more notable ones include this year’s Venom (Marvel, 2018), as well as some recent DC films: Batman v Superman: Dawn of Justice (DC, 2016), Suicide Squad (DC, 2016), and Justice League (DC, 2017).
According to critics, Marvel still has a slight edge over DC, getting 7% higher Metacritic scores on average.
Worth the investment?
Marvel seems to be beating DC both at the box office and with critics. But Marvel also spends a bit more than DC on its films. Would our graphs tell a different story if, instead of looking at raw earnings, we looked at return on investment as correlates with critical reception?
The majority of the movies didn’t stray too far from the average in terms of their return on investment or ROI; however, this made certain outlier movies stand out even more.
Best and Worst Bang-for-Buck
The most obvious outlier is Deadpool (Marvel, 2016) which had the highest ROI among all movies listed (almost five times the average!), while also achieving an above-average Metacritic score. Just below it in ROI is DC’s Batman (DC, 1989), which was able to achieve an even higher Metacritic score.
Another outlier, with a relatively high ROI, but a pretty low Metacritic score, is Venom (Marvel, 2018); it managed to achieve a similar ROI to Avengers (Marvel, 2012) and Black Panther (Marvel, 2018), while receiving an even lower Metacritic score than Green Lantern (DC, 2011).
Unfortunately, superhero films aren’t always a good investment, as there are a handful of (mostly DC) films that actually cost more money than they earned: Supergirl (DC, 1984), Superman IV (DC, 1987), Catwoman (DC, 2004), Punisher: War Zone (Marvel, 2008), and Jonah Hex (DC, 2010).
The Unexceptional Spider-Man
A film that’s more difficult to notice in the chart is Spider-Man 3 (Marvel, 2007), which, despite all the buzz, both negative and positive, was pretty unremarkable — neither good nor bad relative to the other movies we plotted, in terms of both metrics.
The Fall of Superman
An interesting series of movies is the Superman films from 1978-1987. Both Superman (DC, 1978) and Superman II (DC, 1980) were well received by critics, achieving very similar Metacritic scores; despite that, Superman II was unable to match its predecessor’s financial success. The movies that followed got progressively worse in terms of both metrics; Superman III (DC, 1983) failed to impress the critics, and Superman IV (DC, 1987) was so disappointing it actually lost money in the box office.
On average, Marvel films had 36% higher ROI than DC films.
The Final Verdict


Overall, Marvel trumps DC in all the metrics we explored: box office gross, Metacritic scores, and return on investment.
While it does appear that Marvel reigns supreme in the realm of superhero films, we’ve only just scratched the surface of this debate. This is a rivalry that has spanned decades and mediums. What insights would we uncover if we compared these metrics over time? Would the results be different if we looked at TV or comics instead of films?
Is the battle over...or has it only just begun?
Notes on the Data
Data Sources


