A whole new ball game: Quantifying changes in NBA basketball over the past 30 years
October 19, 2018
Arguably the highest level of basketball in the world is played in the NBA, the oldest professional basketball league in existence. The game is constantly evolving, with each team adjusting strategies and styles to outcompete the rest.
We can measure this change using ‘basketball analytics’—quantitative measurements of various player- and team-level statistics. Casual fans and professional analysts use these stats in countless debates, while NBA team front offices and coaching staff use analytics for team management and making business decisions.
We scraped almost 40 years of team-level statistics from Basketball Reference for all teams from the 1979-80 NBA season (the year the 3-point line was introduced) to the 2017-18 season. These stats were regular season, per-game averages for each team, and included both basic stats (e.g., 2-point and 3-point shots attempted and made, rebounds, assists, steals, blocks, turnovers, etc.) and ‘advanced’ stats (effective field goal percentage, pace, free throw attempt rate, etc.).
So how has the NBA changed overall, at least by the numbers? We explore some of the biggest changes below.
Rise of the 3
Of all the changes in NBA basketball, one of the most obvious is the rise of the 3-point shot. The number of 3’s attempted per game has risen from a league average of less than five a game in 1980 to almost 30 a game today. On the other hand, teams have mostly been taking a lot fewer 2’s. Today, a typical NBA team takes about 60 2’s a game, as opposed to about 80 to 90 a game back in the 80’s.
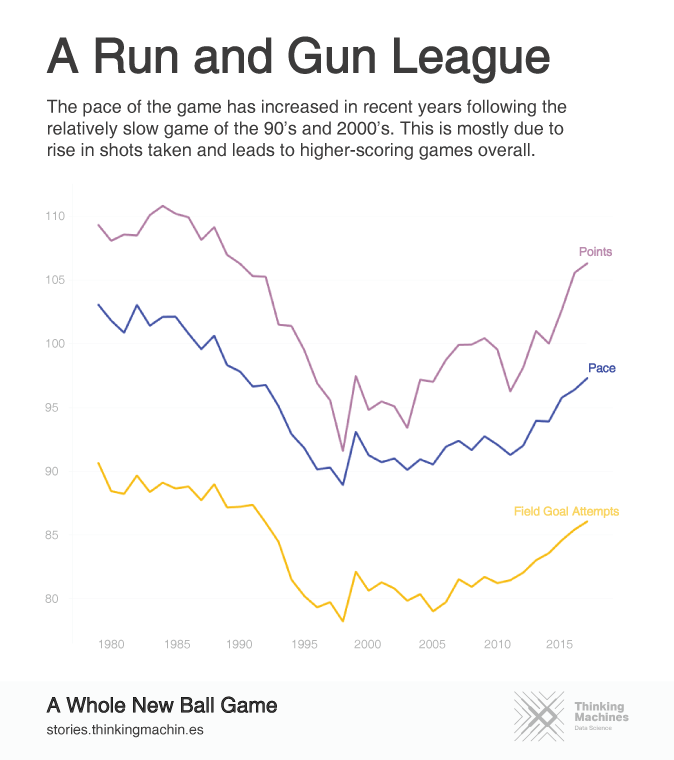
On the Nature of Pace and Possession
The dynamics of possession has changed as well, as the game has begun to speed up in recent years. While not as high as it was in the 80’s, the ‘pace’ of the game (measured by the number of possessions per 48 minutes) has increased by about five to 10 per team per game since the 2000’s (that amounts to about 10-20 extra possessions per game—more basketball for us to enjoy!). However, this is not due to turnovers, personal fouls, or free throws (i.e., actions that result in changing possession), since all these stats have been dropping since the 80’s. Rather, it is probably due to the recent increase in shots attempted throughout the league, and the overall drop in offensive rebounding percentages (and conversely the rise in defensive rebounding percentages).
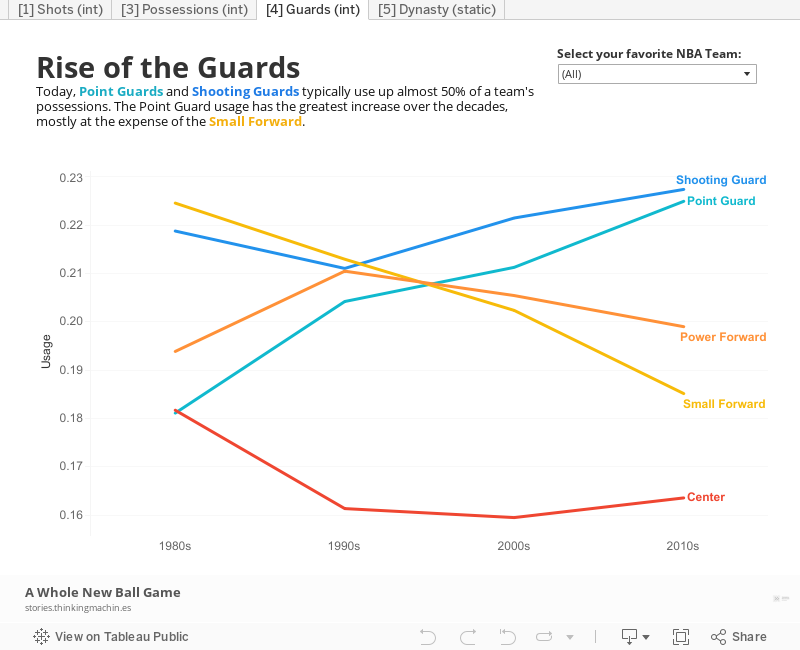
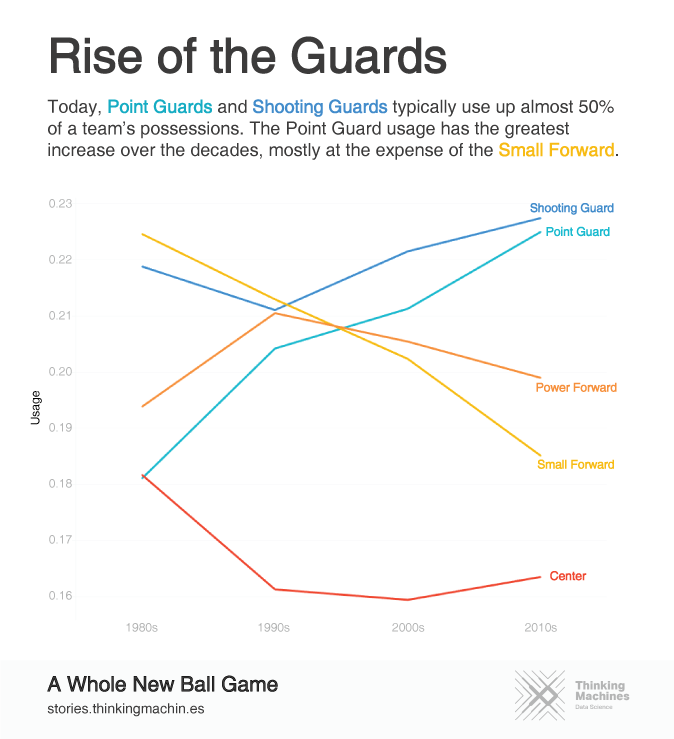
Changing of the Guard
Usage rates (i.e., the proportion of possessions used by a player by either shooting, winning free throws, or committing a turnover) across the five traditional positions have changed over time as well. The Point Guard’s rising usage rate reflects its evolution from a facilitator-type role to one that takes more responsibility in scoring. The increase in Point Guard usage rates has mostly come at the cost of Small Forward usage rates, which have dropped to below 20%, after enjoying long periods of usage rates well above 20% in the the 80’s and 90’s. Meanwhile, Centers have always typically used below 20% of possessions, but their usage rates have actually increased slightly in recent years.
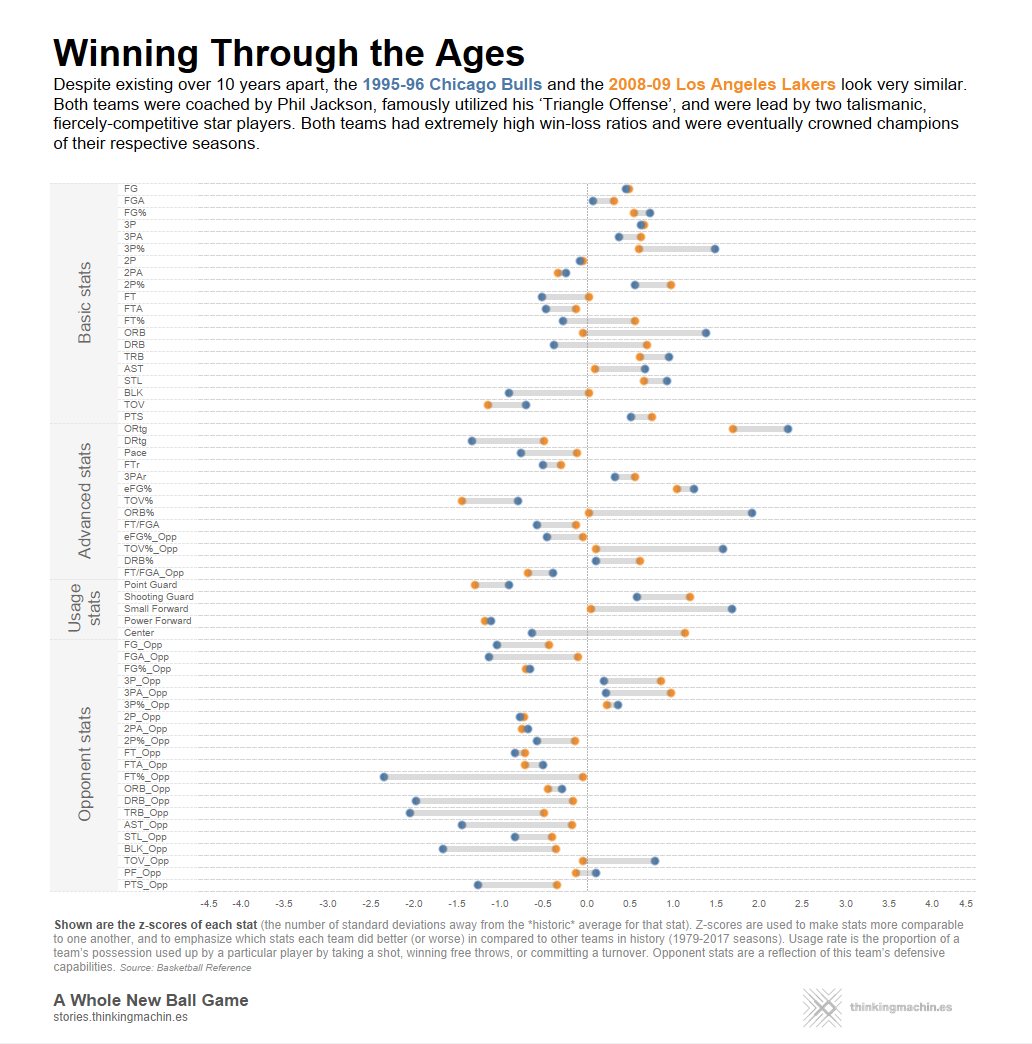
Across the Ages
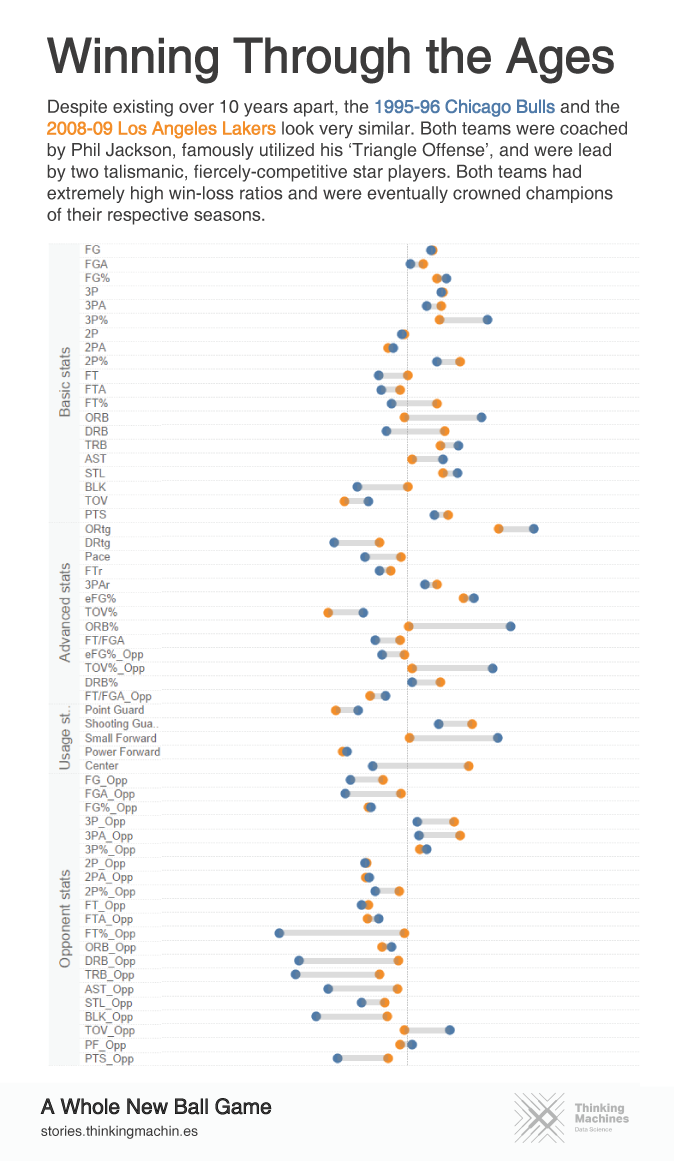
Though we expect that teams separated by many years would tend to look very different from one another, occasionally we find teams that look interestingly similar given their age gap.
Sometimes teams from different eras can look very similar thanks to a common coach, system, and similar-looking key players. For example, when we looked at all teams at least 10 years away from the 1995-96 Chicago Bulls, the most similar team to them was the 2008-09 Los Angeles Lakers. Both were coached by Phil Jackson, both utilized his famous triangle offense, and both had talismanic star players. This system evidently worked, as both teams are among the most successful in NBA history. (However, it doesn’t always work , especially when folks aren’t on the same page.)
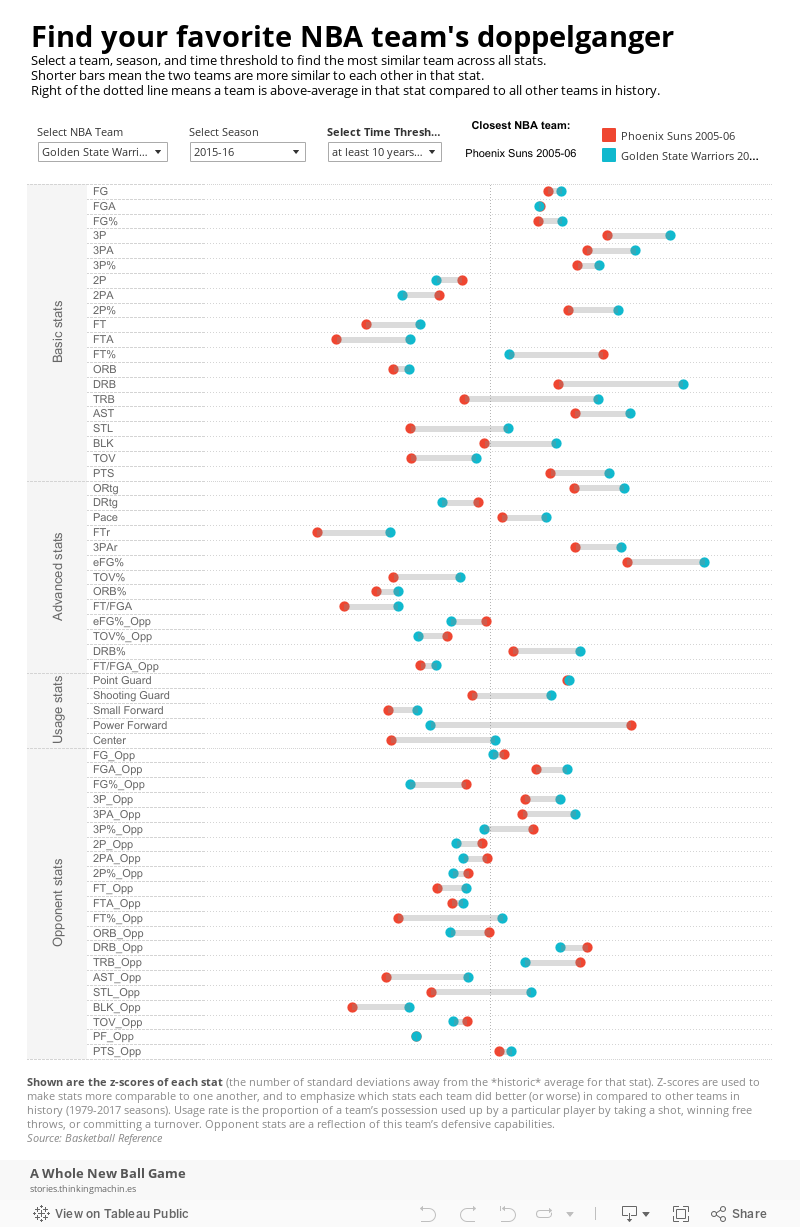
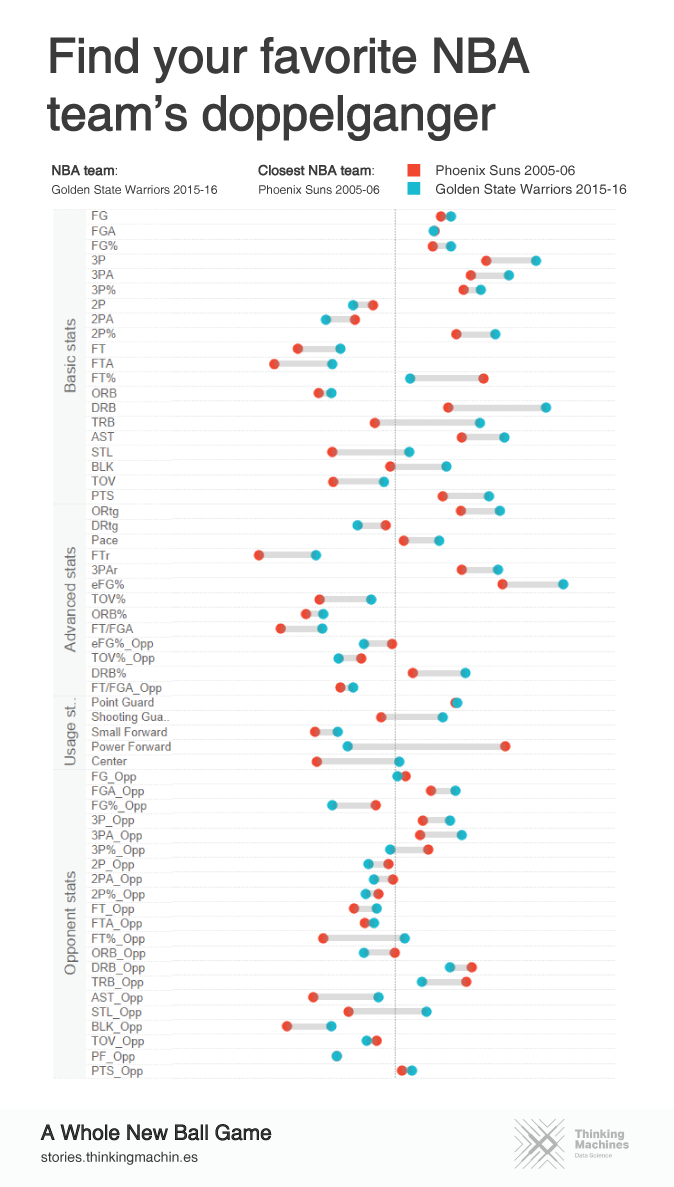
Some teams were, almost tragically, a bit too ahead of their time. Case in point: The 2005-2006 Phoenix Suns. A full ten years before the 2015-16 Golden State Warriors turned the run-and-gun style into a dynasty-sustaining strategy, the Suns were already above average in terms of 3-point shooting, assists, effective field goal percentage, overall offensive rating, and point guard usage. Alas, innovation alone doesn’t win the war. Just ask Friendster.
Dynasties
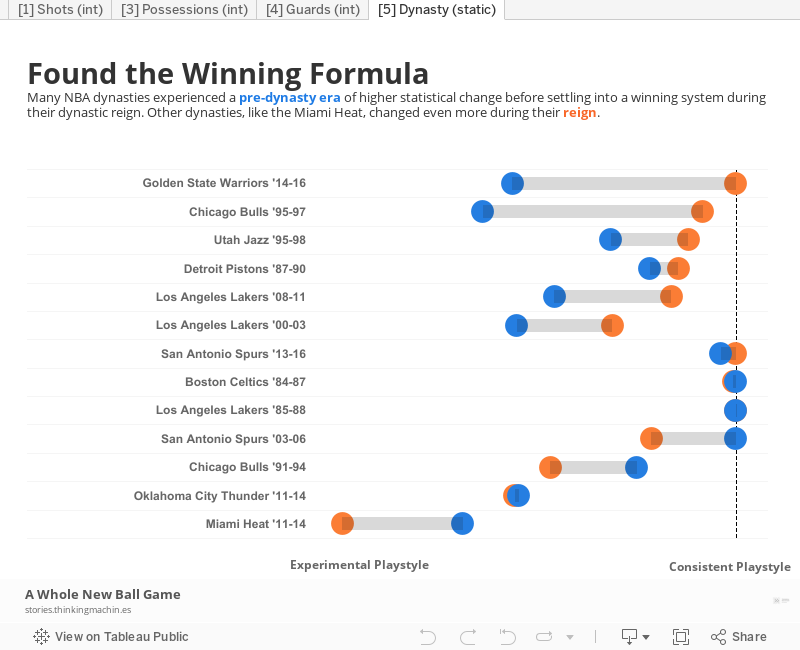
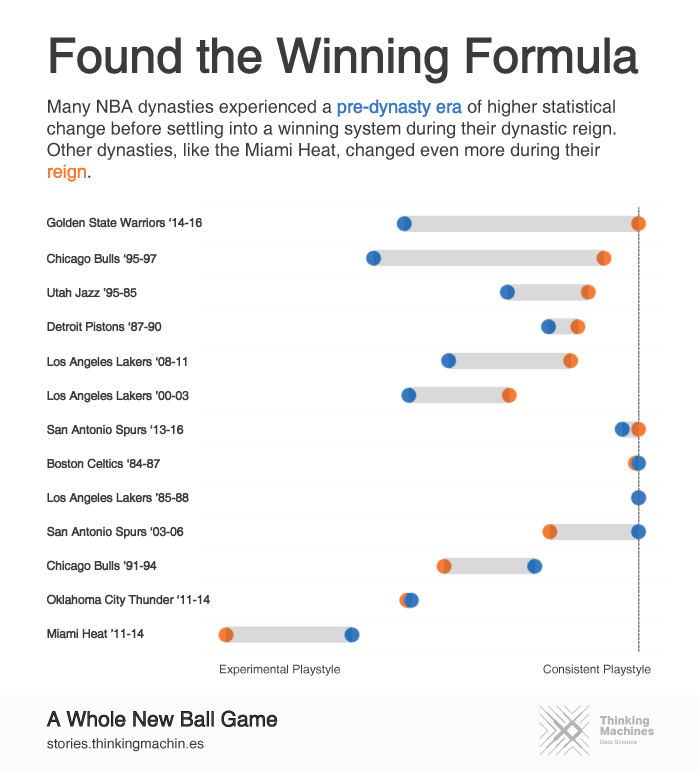
Certain teams tend to change a lot from year to year, while others tend to stick to what they know. To examine how tendency to change affects success, we looked at the change in per-season stats of the top NBA ‘dynasties’ (i.e., teams that dominated the league for several consecutive seasons) based on FiveThirtyEight’s rankings.
Many top NBA dynasties exhibited similar life cycles: a pre-dynastic period of relatively higher change in per-season stats (possibly representing periods of adjustment and experimentation), followed by a dynastic reign of lower change where they maintained greater statistical consistency. In other words, during their period of dominance they had already figured out a solid system that worked for them and stuck to it, while all the other teams were still trying to find theirs. For example, from the period of 2014-17, the Golden State Warriors changed little statistically when compared to all other teams during these seasons. But during the 2011-13 seasons, before their dynasty was established, the Warriors were closer to the league average in terms of statistical change.
In contrast, the ‘11-14 Miami Heat dynasty changed even more during their dynastic reign than during their pre-dynastic era. This makes sense, as the Heat dynasty was assembled quickly with the signing of key free agents, and even during their reign they continued to make significant alterations to their roster and play.
The Modern Game
So in a nutshell, how has the typical NBA team evolved? A typical 80’s team was fast-paced, favored the 2-point shot, was hungry for offensive rebounds, and relied mostly on Forwards for scoring. Think Bird’s Celtics. On the other hand, teams from the 90’s and 2000’s were relatively slow-paced, and relied on Forwards and Guards for scoring. Think MJ’s Bulls, and the early Popovich Spurs. Finally, the modern NBA team loves the 3, is once again fast-paced, and is mostly reliant on Point and Shooting guards for scoring. The Warriors and Rockets of today are embodiments of this style.
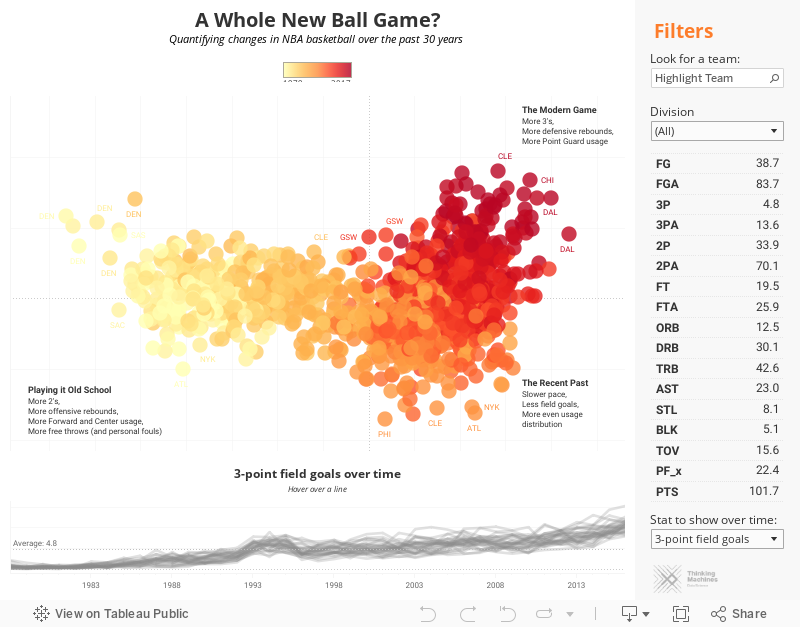
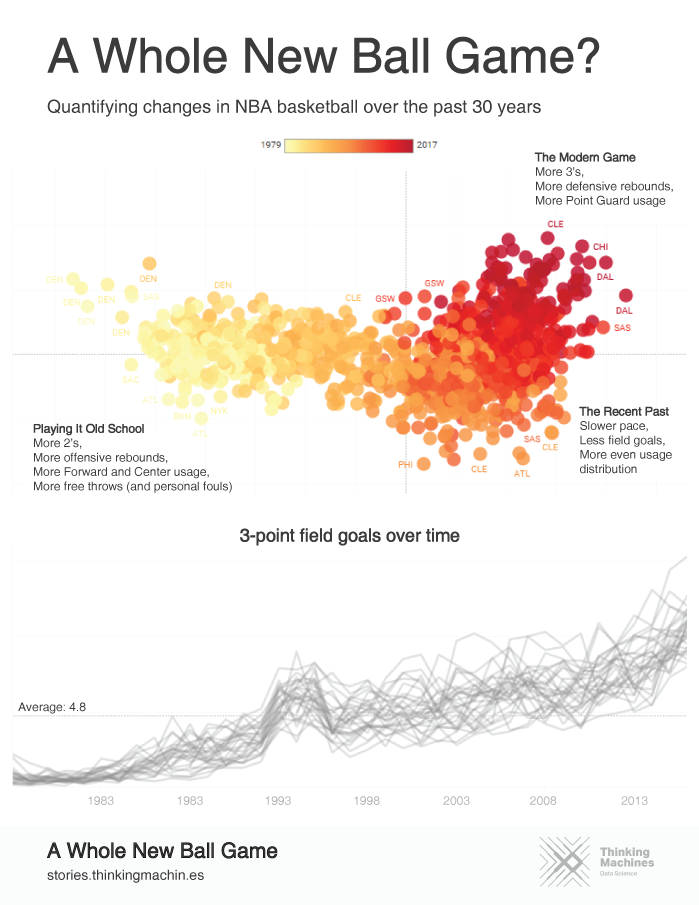
Visualizing Differences
All the analyses above pretty much boil down to quantifying differences. Whether it be across seasons or across teams, we used different ways to measure how the game has changed (or stayed the same).
While the visualizations above are useful when we want to compare a few statistics or a few teams simultaneously, it becomes more difficult to visualize as we increase the number of things we want to compare. But what if we want to compare numerous stats at once, across all the teams, and over multiple seasons?
To do this we used a dimensionality reduction technique called Principal Component Analysis (PCA) to reduce our 60-stat dataset to 2 dimensions. Each axis/dimension of the PCA is a combination of the most important stats—i.e., the stats that account for the largest amount of variation across teams and seasons. The PCA plot is a caricature of team distances from one another; it does not show the exact distances between teams, but an estimation. Thus, it is an effective way of plotting high dimensional data all at once, allowing us to visually compare teams. Distances between points on the PCA approximate their true distances in terms of all 60 stats; this means that teams close to one another on the PCA are generally more similar to one another than distantly-located teams.
Use our interactive viz below to explore differences across teams, seasons, and stats!
Reach out to us
How can our team help you find insight in data? Leave us a note or e-mail us directly at [email protected]