How exposed is your barangay to different natural hazards?
September 12, 2018
This blog post is a collaboration with David Garcia, a Filipino geographer and cartographer currently taking his doctorate at the University of Canterbury in New Zealand.
The Philippines is the riskiest major country in the world, according to the Bundis Entwicklung Hilft’s World Risk Report of 2017. Situated in the middle of the Pacific typhoon belt and the Ring of Fire, the Philippines is vulnerable to storms, earthquakes, volcanic eruptions, and other natural disasters exacerbated by the effects of climate change.
From Data to Maps to Safety
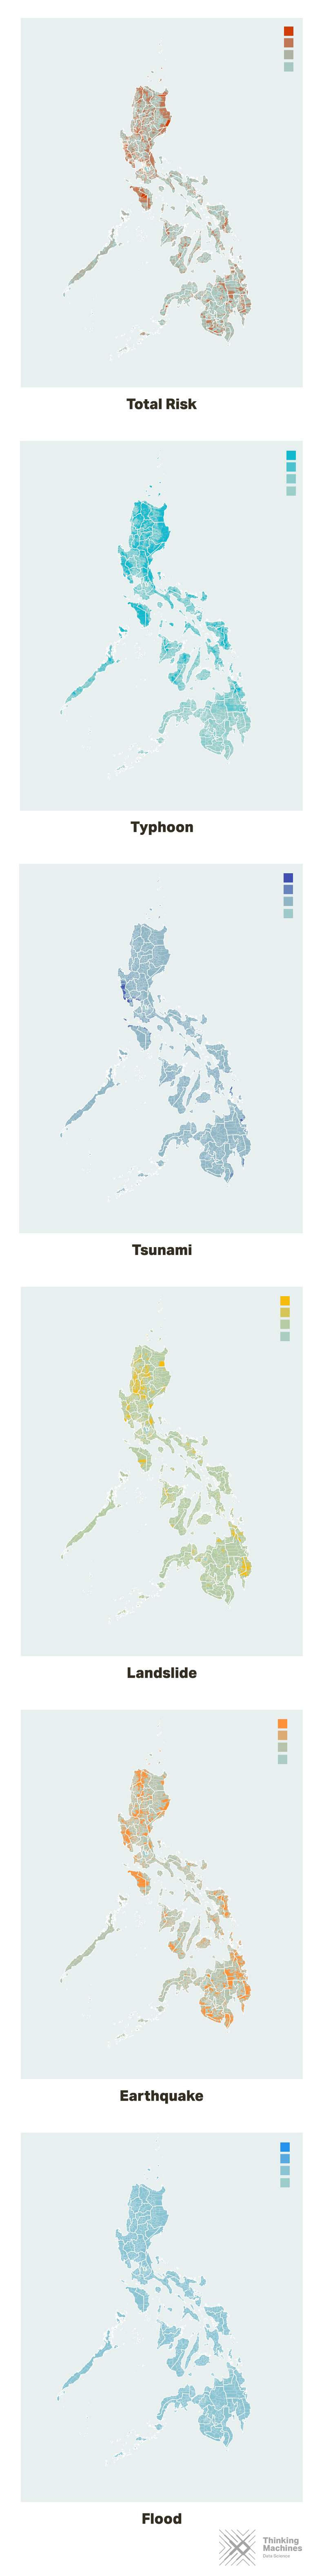
But how is the risk spread across the Philippines? Where are the riskiest and most hazardous areas? What parts of the country experience the worst floods, most volcanic eruptions, and largest tsunamis? We’ve generated a hazard map to visualize the areas of the country hit hardest by different types of natural calamities. We hope this information can help policy makers and government officials focus their resources on addressing their top threats.
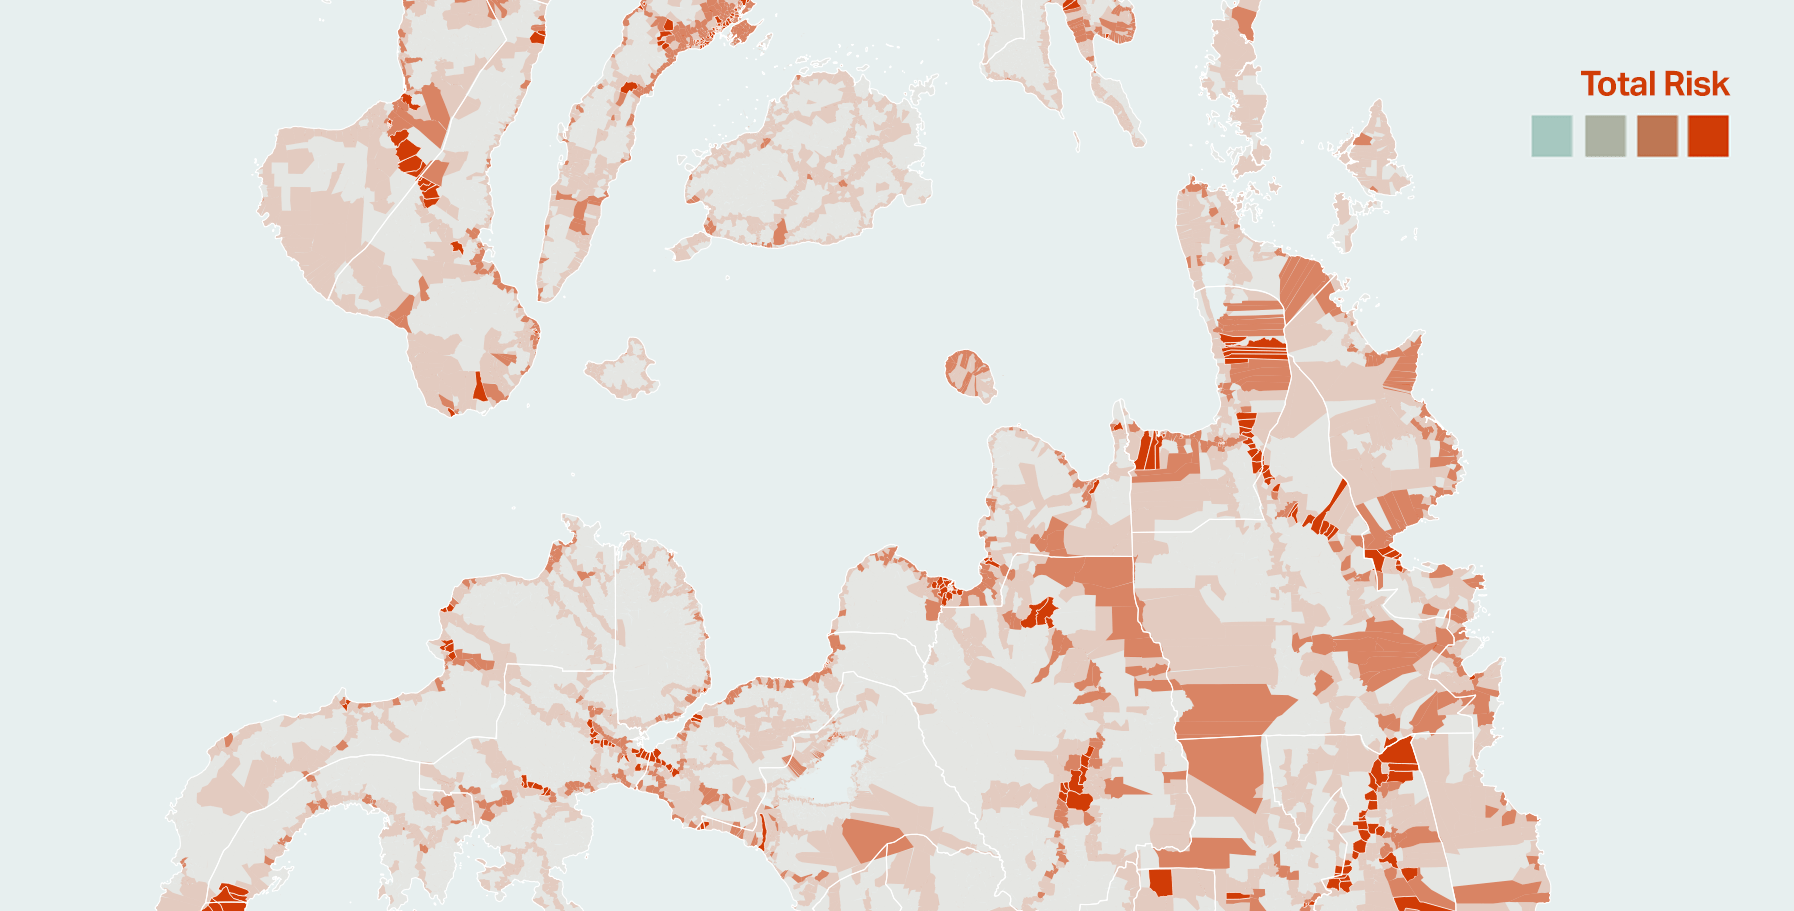
To what types of natural hazards is your barangay most exposed?
At the national scale, there are no areas that are completely safe from hazards – only places of varying levels of risks. But the damage that can be caused by a disaster also depends on the affected communities’ capacity to prepare, respond, and adapt. We have to zoom in and see how local conditions affect the impact of a disaster.
This interactive map allows us to see the risk of any Philippine barangay from various natural hazards. The more darkly-shaded areas are at higher risk from the hazard type selected. Places with higher population are also considered at higher risk. So for example, if two areas are hit by the same number of typhoons every year, the one with the higher population will be at higher risk to typhoons. We’ve also computed an overall “risk score” for each barangay which combines a barangay’s risk from various types of hazards with socioeconomic indicators like population and economic development. Municipal scores were computed by getting the aggregated risk scores of each component barangay.
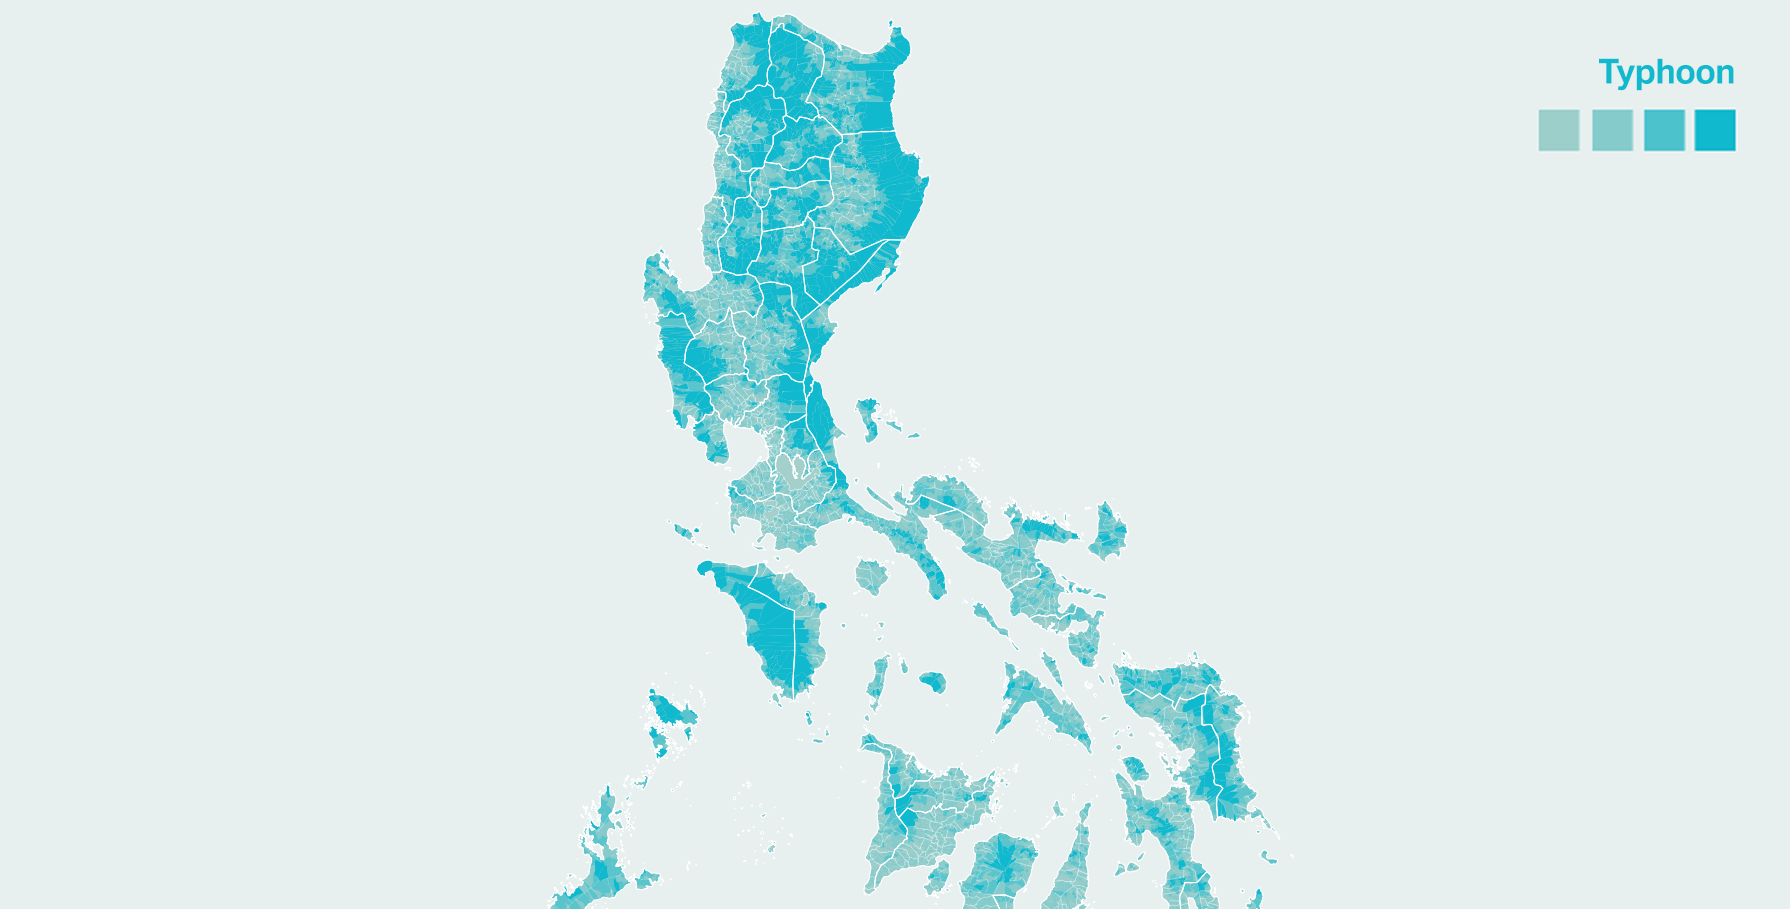
More than half of Filipinos are exposed to typhoons.
Typhoons cause more death and destruction in the Philippines than any other type of natural disaster. Of the roughly 20 typhoons that enter the Philippine Area of Responsibility every year, a quarter are destructive. Northern Luzon is particularly hard-hit by storms.
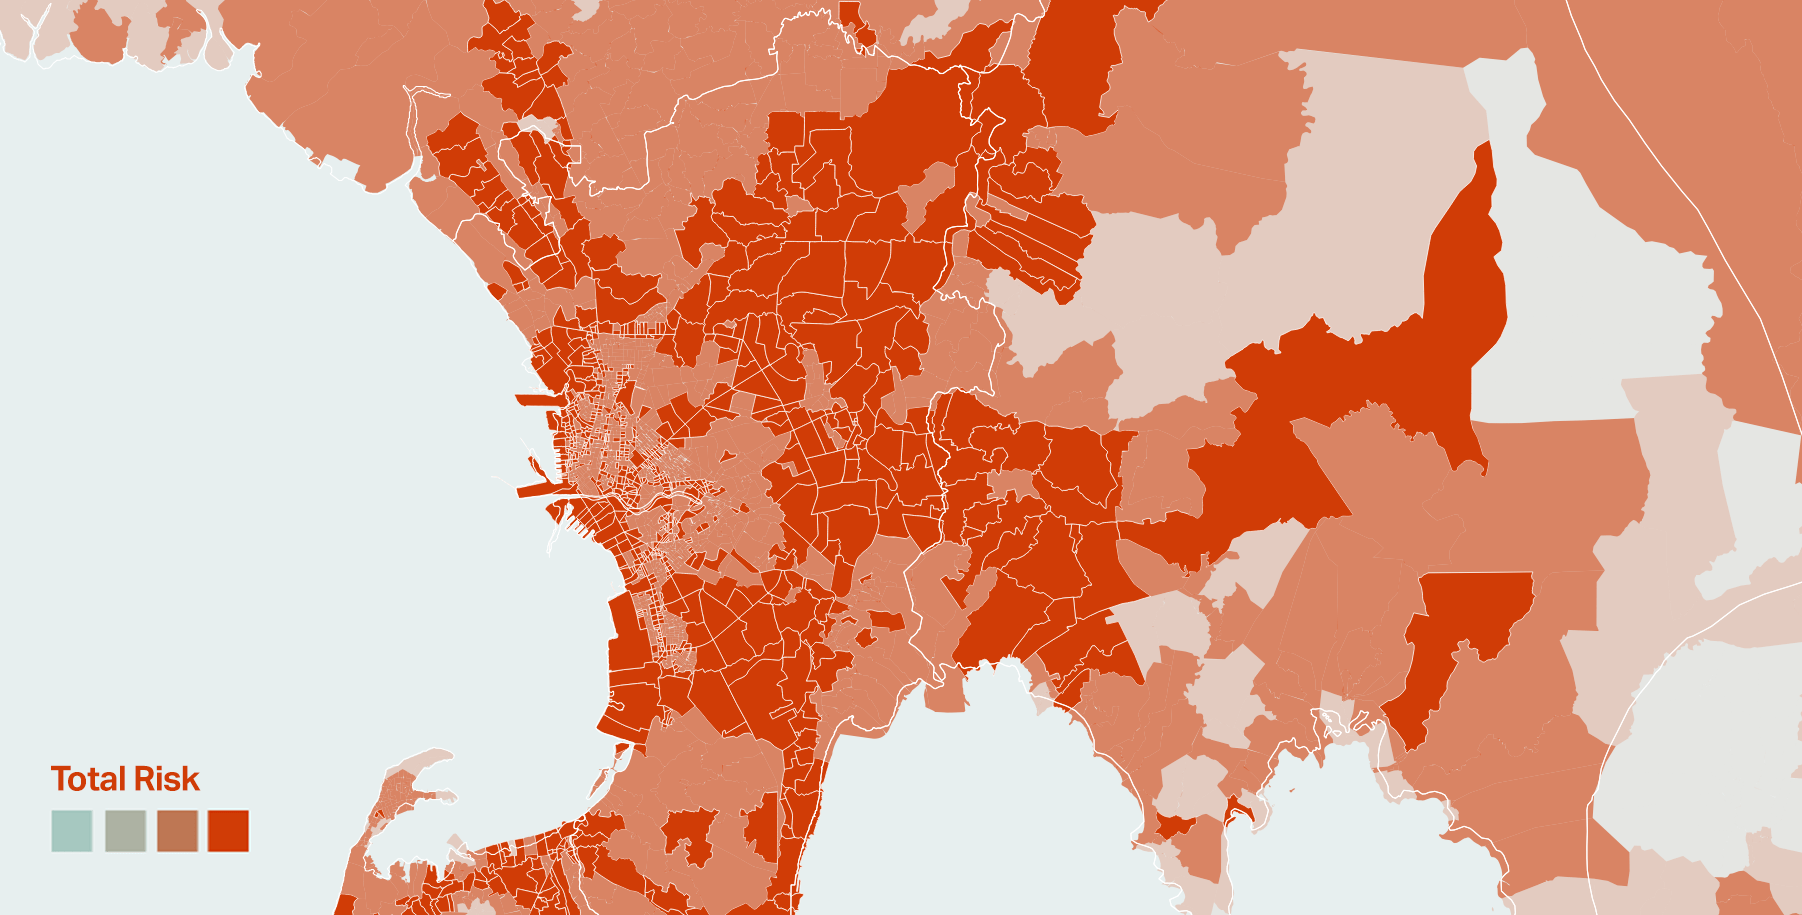
NCR at highest risk from many types of hazards
Home to an estimated 24 million inhabitants or 25% of the entire country’s population, Metro Manila is also regularly exposed to typhoons, floods, and potential earthquakes. If we want to ensure safety for the largest number of Filipinos living in a relatively small space, NCR is arguably one of the most important places to focus on.
Southern Visayas and Mindanao are at lower risk from tropical cyclones, but still vulnerable
Compared to areas in Luzon, people in Southern Visayas and Mindanao typically experience fewer tropical cyclones every year. But the level of urbanization in the major cities still puts these populations at risk, especially since they are also near some fault systems. These regions are also home to some of poorest and most vulnerable Filipinos, who may not have the resources to adapt to a volatile climate.
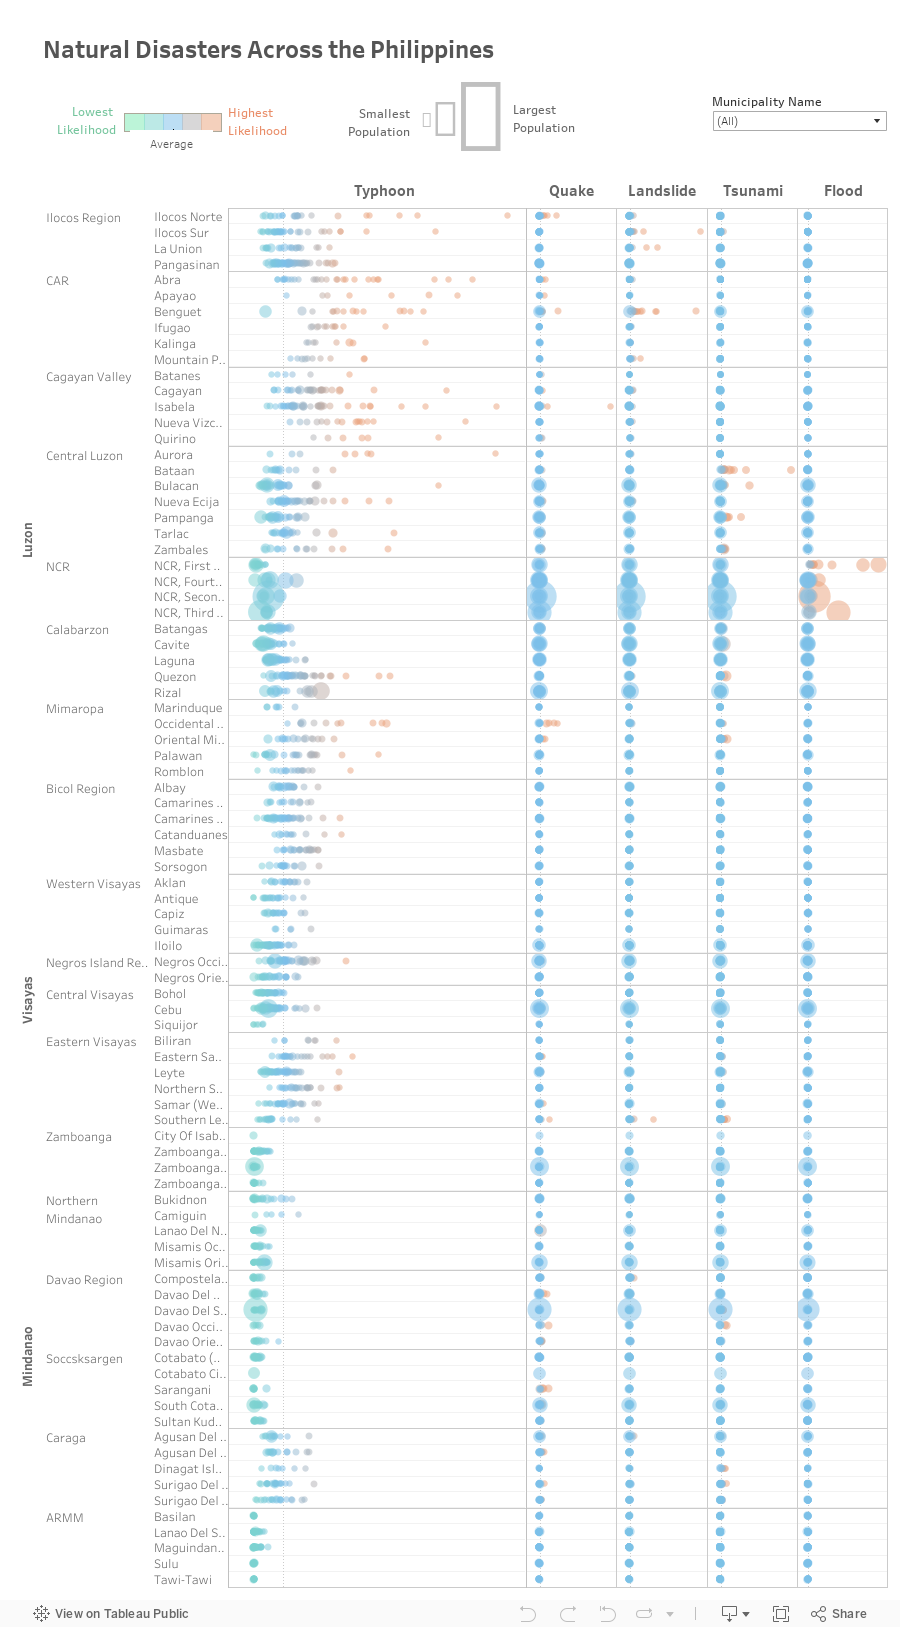
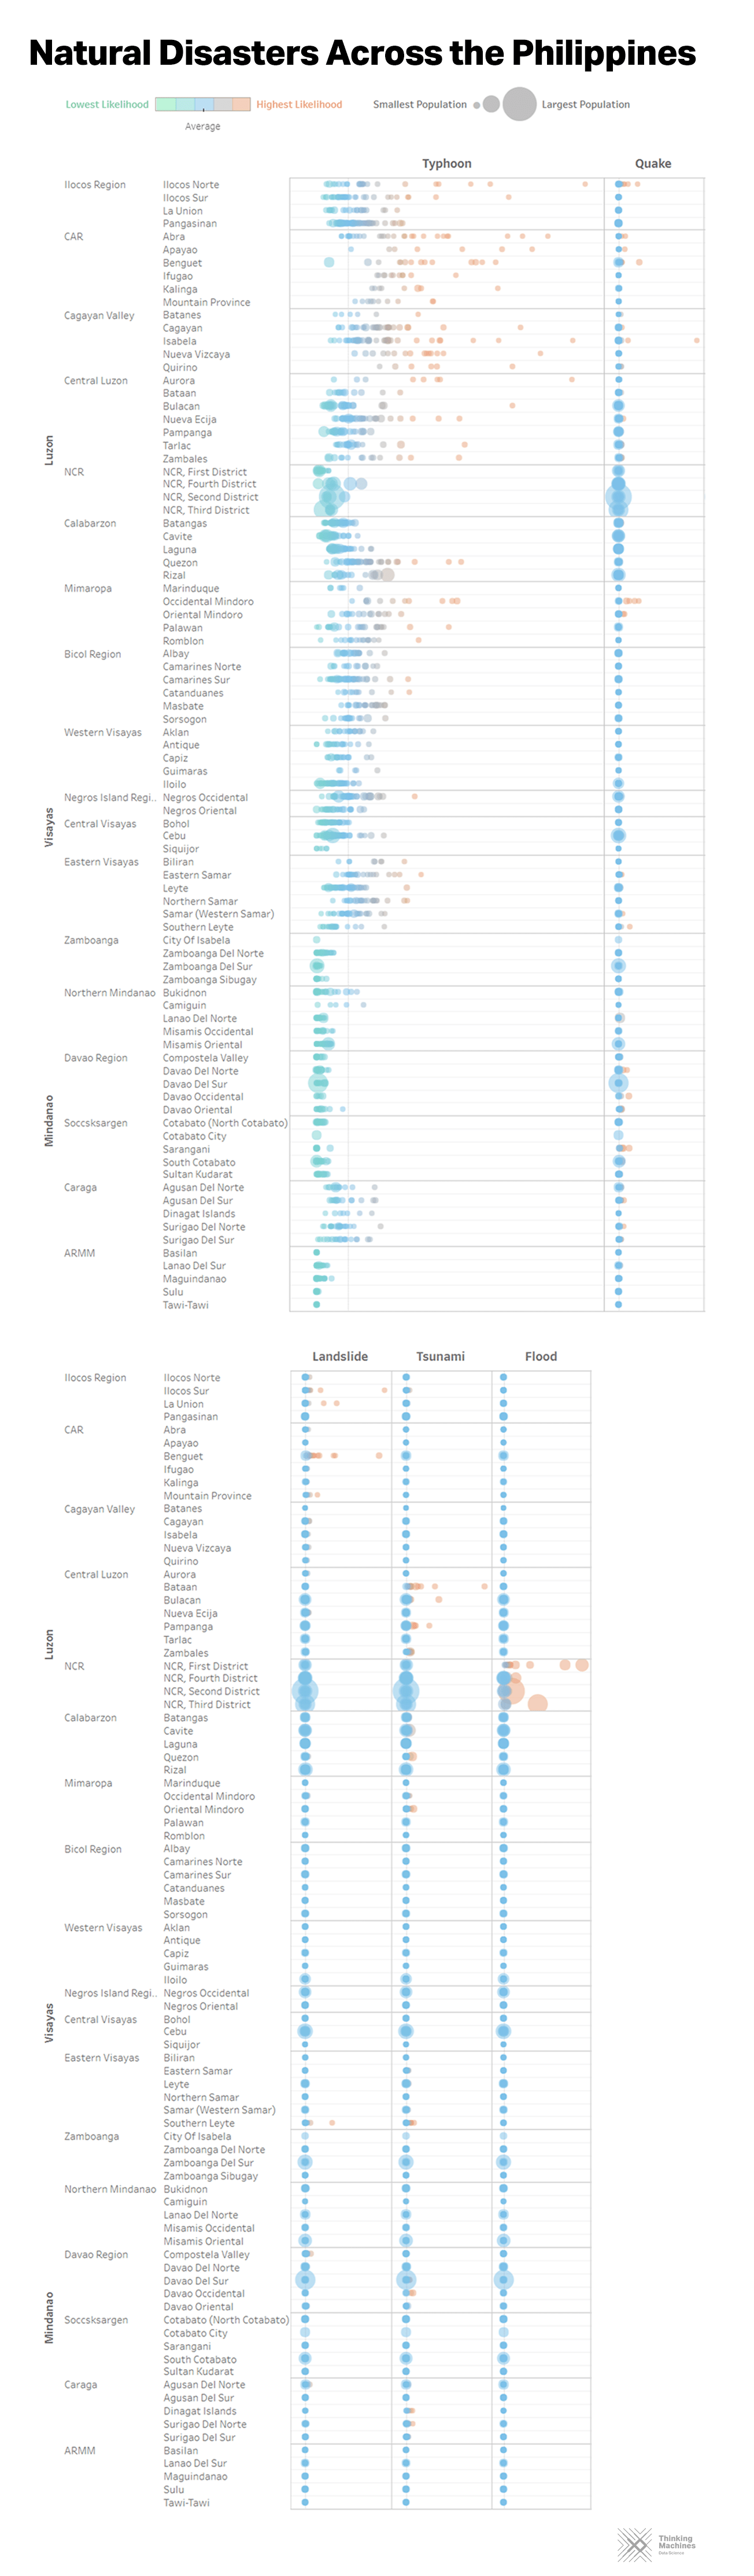
Another Look at Risk Across the Philippines
While traditional maps give an excellent big picture view of where specific calamities have historically been hitting the Philippines the hardest, multifaceted scatter plots allow comparisons between municipalities. This way of visualizing risk and hazard data makes it easier for policy makers and government officials to decide on how to allocate risk reduction resources and to know which municipalities to prioritize.
Some Silver Lining
Despite the gloom and doom that the data may suggest, there is a silver lining. Identifying the areas in the Philippines that are most exposed to disasters can help government, civil society, and the private sector on how to build better infrastructure and focus crisis response efforts. For example, urban planners and architects can propose better designs; local government executives can preposition goods; and citizens can call attention to places of higher risks.
Meanwhile, more knowledge is needed to highlight the socioeconomic vulnerabilities of each barangay, and communities, leaders, and professionals may find these types of data visualisation usable. Arming decision makers, experts, and citizens with useful data can help make people and places more resilient.
Technical Notes
Definition of Terms
- Hazard: Threats represented by geophysical events and processes that may cause deaths, injuries, damages, loss, and destruction (UNISDR, 2009)
- Exposure: People, places, and assets that are in the way of the hazards. (UNISDR, 2009)
- Vulnerability: How vulnerable or how much damage potential hazards could do to an exposed area (a product of hazard and exposure). This is the most important factor we will look at.
- Capacity: Assets and abilities of the exposed element to address risk and vulnerability (Lavell, et. al, 2012)
-
Risk: The UNISDR defines disaster risk as the potential loss of life, injury, or destroyed or damaged assets which could occur to a system, society or a community in a specific period of time, determined probabilistically as a function of hazard, exposure, and capacity.
Hazard x exposure x vulnerability
adaptive capacity
Measures of Hazard
-
Earthquake: Earthquakes for the past 100 years. Count.
Source: USGS. -
Landslide due to Earthquake: Frequency of earthquake due to earthquake. From the site: “unit is expected annual probability and percentage of pixel of occurrence of a potentially destructive landslide event x 1000000.”
Source: UNEP GRID. -
Faultlines: Does a fault cross the barangay? 1 for yes; null for no.
Source: PHIVOLCS. -
Volcanoes: Part or whole of barangay is within the 8-kilometer radius of a volcano. To date, 8 kilometres is the maximum radius used for delineating permanent danger zones for a volcano in the Philippines. Such radius was used for Mayon Volcano recently.
Source: PHIVOLCS. -
Tsunami: Tsunami frequency. From the site: “unit is expected affected percentage of each pixel over a minimum return period of 500 years”
Source: UNEP GRID -
Landslide due to Precipitation: Frequency of landslide due to precipitation. From the site: “unit is expected annual probability and percentage of pixel of occurrence of a potentially destructive landslide event x 1000000.”
Source: UNEP GRID -
Tracks: Cyclone tracks for the past 50 years. Count.
Source: NOAA -
Storm Surge: Exposure to storm surge (1 for low, 2 for medium, 3 for high. See NOAH website
Source: UP Project NOAH -
Flood: Exposure to flood. From the site: “unit is the expected average annual population (2007 as year of reference) exposed (inhabitants)”
Source: UNEP GRID
Socioeconomic indicators
In calculating for each barangay’s level of risk, we considered the number of people living in each area as of 2015 and their relative level of socioeconomic development as indicated by several proxy indicators, including the presence of major roads nearby, number of points of interest inside each barangay, and the level of brightness of this barangay at night, which is known to correlate with economic development. Source of data include 2015 Census of Population and Housing for population and Open Street Map for access to roads and points of interest. The original vector shape file with Philippine Standard Geographical Code and names are from the Information Management Technical Working Group (IM-TWG) of the National Disaster Risk Reduction and Management Council (NDRRMC). See documentation here.
REFERENCES
Bankoff, G. (2003) Cultures of Disaster: Society and Natural Hazard in the Philippines, . New York: RoutledgeCurzon
Kreft, S. et al. (2015) GLOBAL CLIMATE RISK INDEX 2015. Germanwatch. Available at: https://germanwatch.org/en/download/10333.pdf%0D.
Lavell, A. et al. (2012) Climate change: new dimensions in disaster risk, exposure, vulnerability, and resilience, Managing Risks of Extreme Events and Disasters to Advance Climate Change Adaptation, p. 33. Cambridge and New York. doi: 10.1017/CBO9781139177245.004.
UNISDR (2009) ‘2009 UNISDR Terminology on Disaster Risk Reduction’, 2009 UNISDR Terminology on Disaster Risk Reduction. Geneva: United Nations International Strategy for Disaster Reduction, pp. 15, 17. doi: 978- 600-6937-11-3.
UNISDR (2015a) Global Assessment Report on Disaster Risk Reduction. Available at: http://www.preventionweb.net/english/hyogo/gar/2015/en/home/.
UNISDR (2015b) ‘The Pocket GAR 2015 Making Development Sustainable : The Future of Disaster Risk Management’. Available at: http://www.preventionweb.net/english/hyogo/gar/2015/en/home/.
Verisk Maplecroft (2011) Risk Calculators and Dashboards. Available at: https://maplecroft.com/about/news/ccvi.html (Accessed: 15 July 2017).
Wisner, B., Gaillard, J. and Kelman, I. (2012) ‘Framing disaster: Theories and stories seeking to understand hazards , vulnerability and risk’, in Wisner, B., Gaillard, J., and Kelman, I. (eds) The Routledge Handbook of Hazards and Disaster Risk Reduction.
Routledge, p. 22. doi: 10.4324/9780203844236.ch3.