MAPPED: Danger Zones in Metro Manila's Roads
April 25, 2017
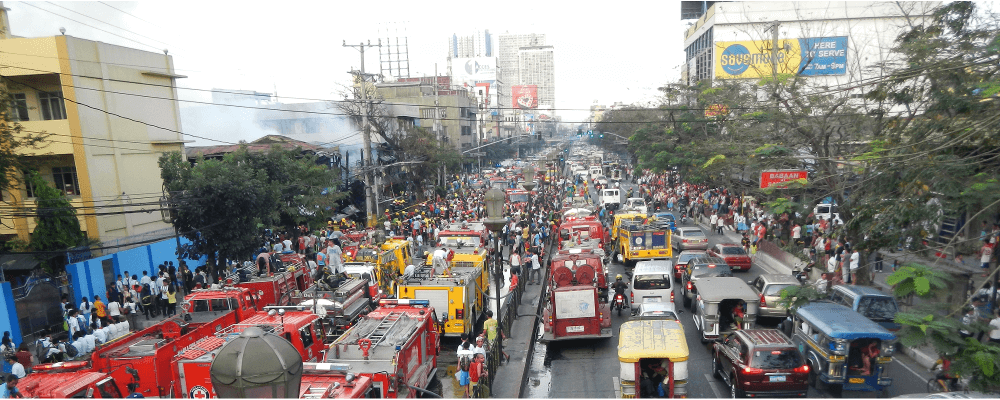
Which roads and intersections are the most accident-prone for motorcycles? Where are pedestrians most vulnerable to injury? Which routes are dangerous for both?
These are just a few of the questions that we wanted to answer last March, when we joined the Road Safety IDEA HACK sponsored by the Department of Transportation (DOTr), Grab and the World Bank. The IDEA HACK Competition encouraged people to come up with solutions using ICT, digital media, and the DRIVER road data platform to address the road safety problem in Manila. Over thirty teams presented creative apps, platforms, websites, visualizations, virtual reality and advocacy campaigns.
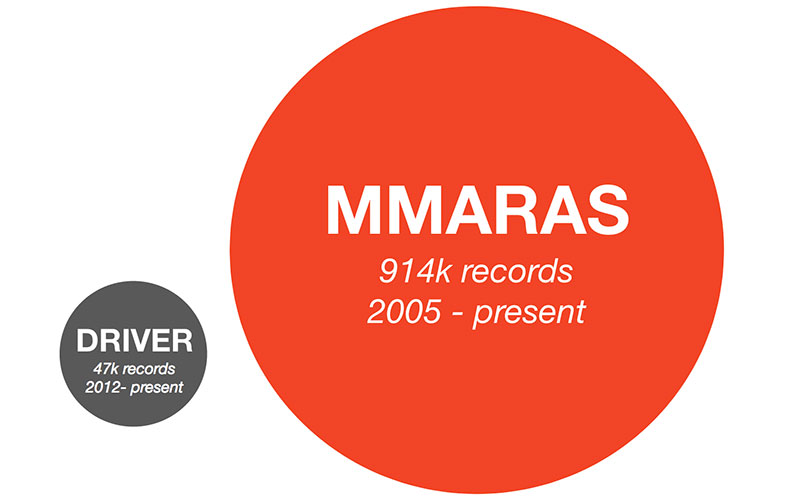
The first part of our submission was entitled “Unlocking Hidden Patterns in 10+ Years of MMDA Road Crash Data” which is a series of online interactive data visualizations based on the MMDA’s biggest road crash data set, the Metro Manila Accident Reporting and Analysis System or MMARAS, a database of 914k road crashes recorded in police blotters and encoded by the MMDA over the past 10+ years. Our submission included our previous stories that we published in late 2015: When are you most in danger on the road?, The Most Accident-prone Streets and Cities in Metro Manila (2014) and More than 57,000 Metro Manila Pedestrians Hit by Vehicles Since 2005.
When we first published these blog posts back in 2015, we weren't able to map road crashes, since the MMARAS data doesn't have geocoordinates. Thankfully, the DOTr recently launched a new dataset on road accidents that does have longitude and latitude information. This is the Data for Road Incident Visualization Evaluation and Reporting platform, also known as the DRIVER platform. Through the DRIVER website, anybody interested in doing geospatial analysis on road crashes can now access crash records from MMDA's Metrobase, Bonifacio Global City, and local governments in Cebu and Diplog.
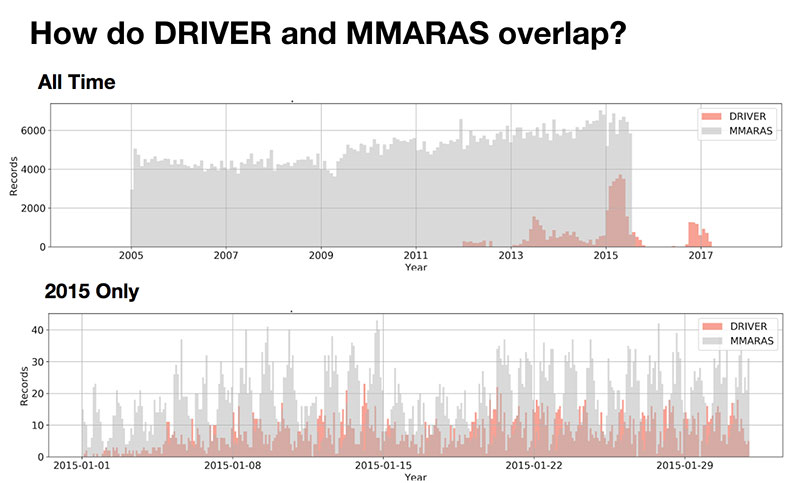
 What happened 2015? 😱
This timelapse shows that there are more entries in 2015 in the DRIVER dataset. However, this doesn’t mean that 2015 was a particularly dangerous year, just that the DRIVER dataset is lacking information from the other years.
While the DRIVER database has at least 45,000 records dating back to 2012, this is quite small compared to MMARAS, which has a whopping 914,000+ records of road accidents between 2005 and 2016. The process of adding geocoordinates to the MMARAS dataset so it can be integrated into DRIVER is still ongoing, so keep in mind that these visualizations, based only on DRIVER, show an incomplete picture of the road safety problem.
Another visual concept we developed during this competition was to categorize the various road incidents in Manila by vehicle.
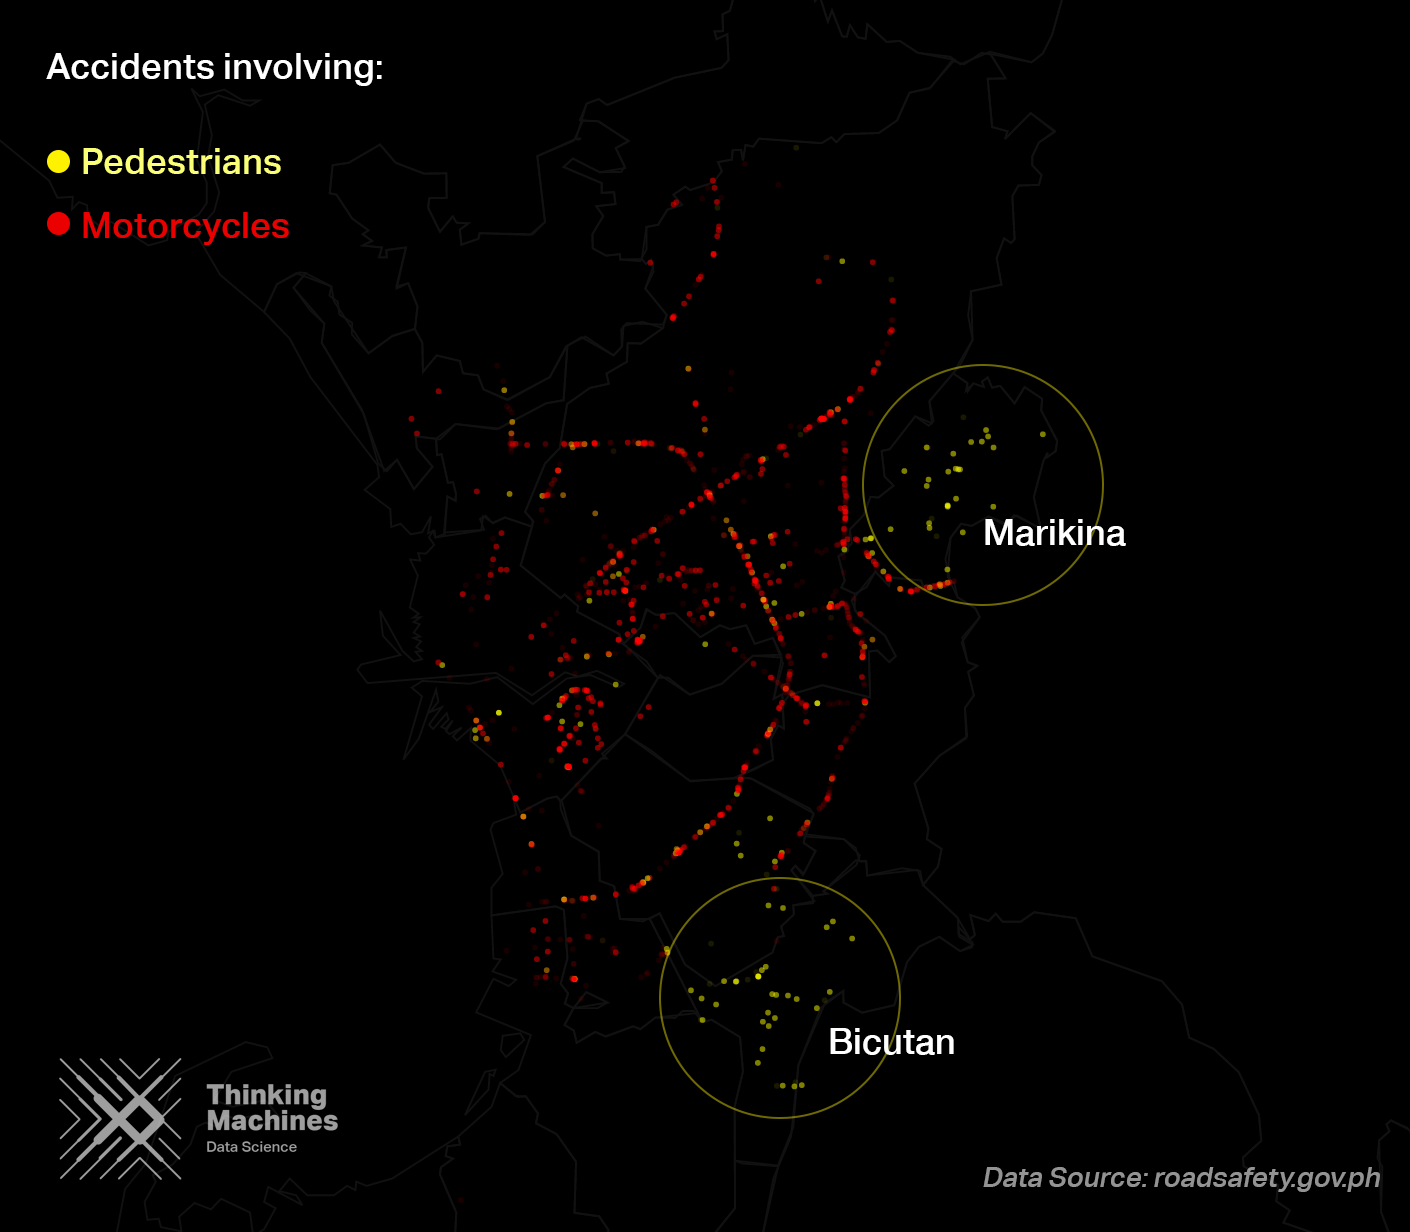
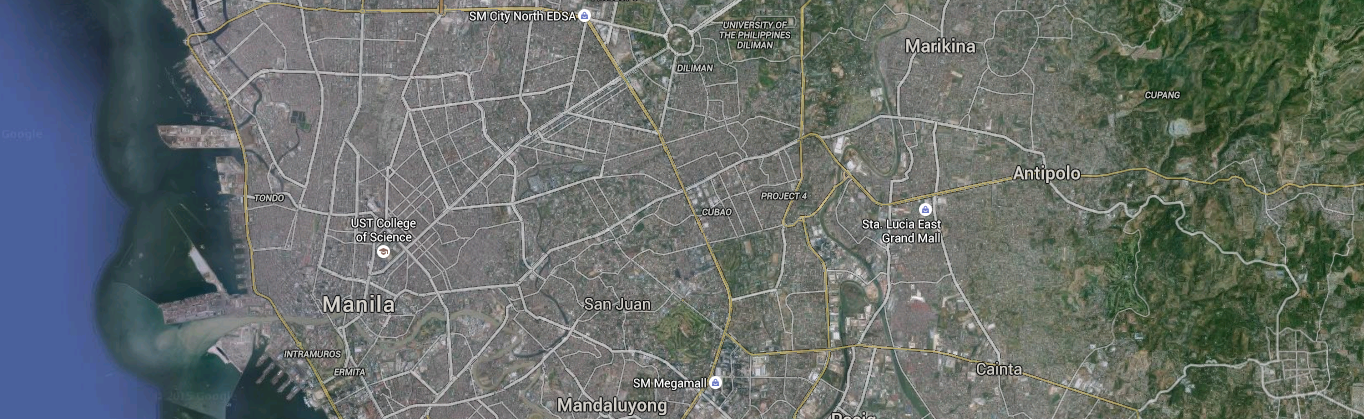
In our previous analysis is of MMRAAS data, we previously discovered that motorcycles are the most frequent vehicle involved in accidents that result in either injury or death, and that pedestrians are the most frequently killed. We made a map that shows where incidents involving motorcycles and/or pedestrians take place.
Layered maps like these make it easier to spot different places where certain types of vehicles or road users might be more vulnerable. For example, the map above shows clusters of pedestrians getting hit in Bicutan and Marikina.
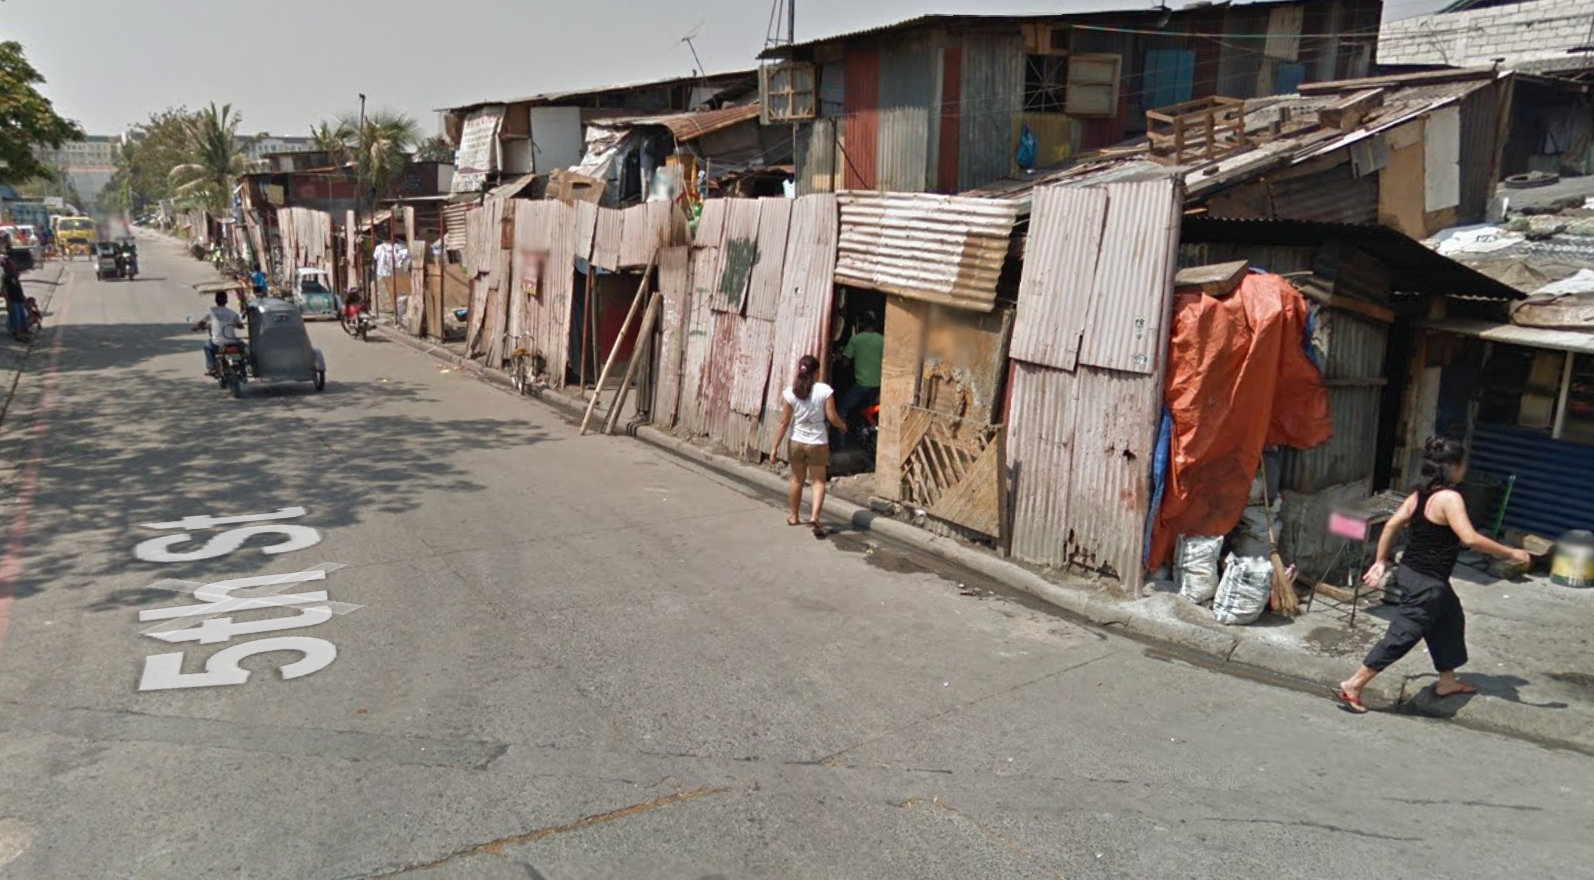 Three accidents occurred at the same spot in Aquilina cor. 5th St. in Marikina
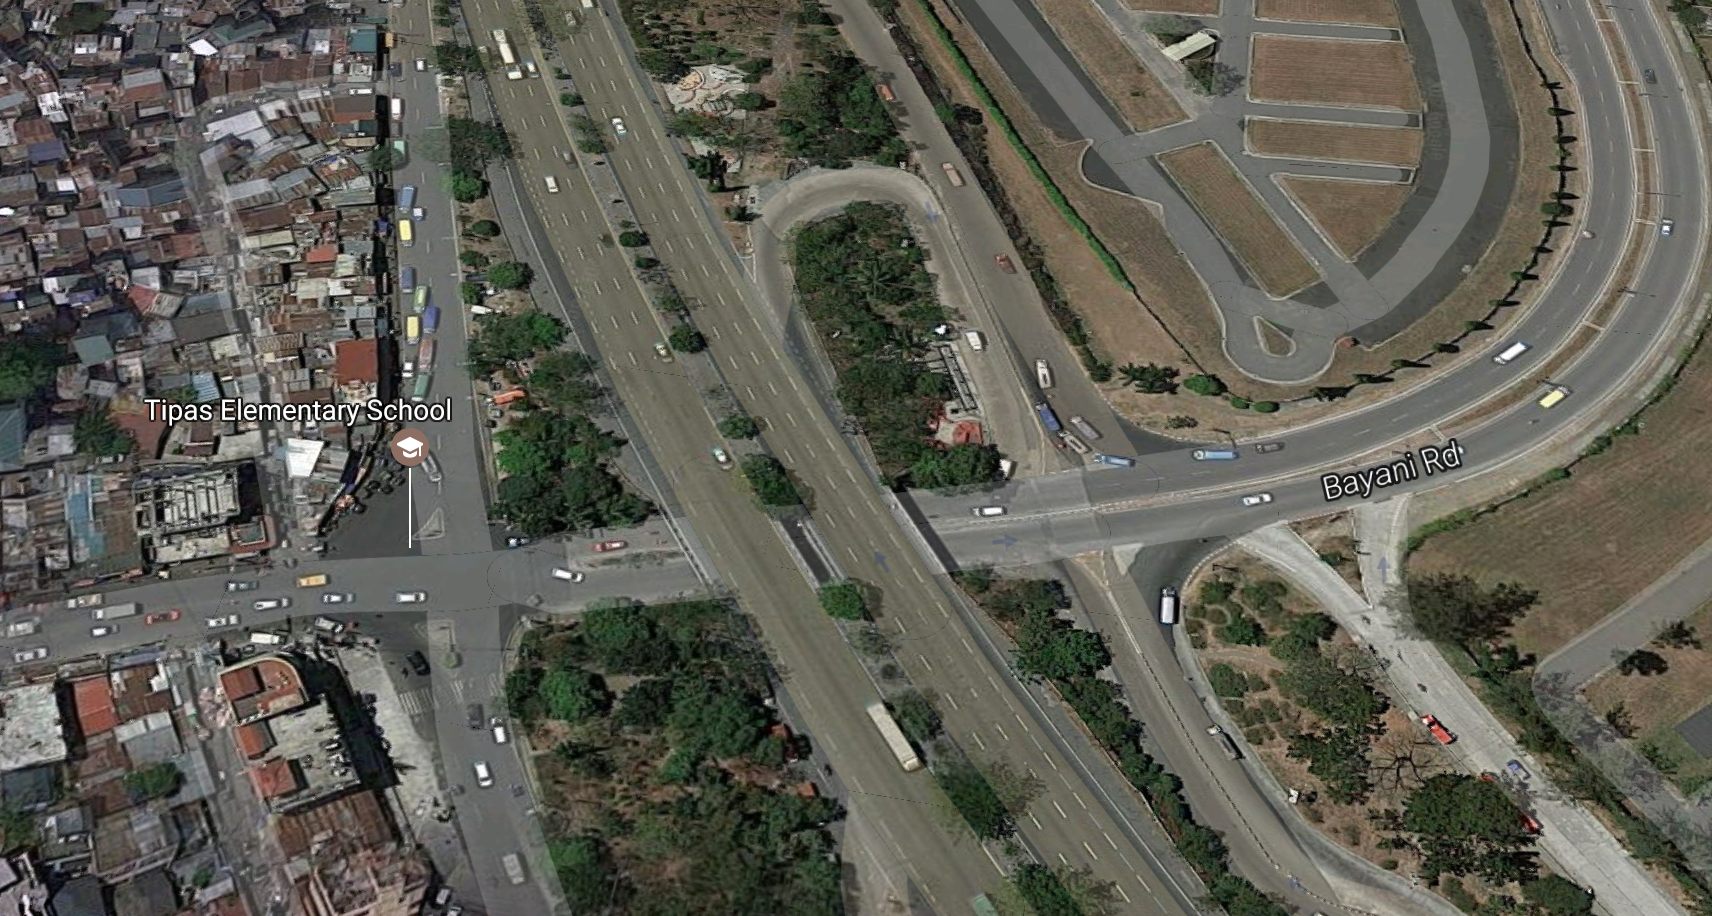 Several accidents occurred at C5/Bayani Road/Tinga Ave. Interchange
This is important because knowing the exact road segments and intersections where the most accidents occur can help the MMDA develop more targetted and evidence-based policies. You can also use data to measure the impact, if any, made by certain interventions.
Here is an interactive bird's eye visualization with the different clusters that we’ve identified using this open source Node Geoclustering code by Sebastian Volnhalls:
If you want to explore the whole map and identify accident clusters for yourself, you can check out our zoomable map with street names created with Folium and Leaflet. If you find anything interesting, feel free to send us an FB message or a tweet; we’d love to know what you think!
Shameless plug:
We are happy to announce that we were able to place third in the Road Safety Idea Hack 2017 competition.

If you want to learn how to tell data stories the Thinking Machines way, we are holding a workshop next next week. So hurry up and register before slots run out!