The Most Accident-prone Streets and Cities in Metro Manila (2014)
October 23, 2015
This is the second of a three-part series of data stories on road safety. Follow the links to the first and third installments:
- Part 1: When are you most in danger on the road?
- Part 3: 57,000 pedestrians hit by vehicles in Metro Manila since 2005
This is part of our ongoing set of stories on road safety in Metro Manila. Our sincere thanks to the Metropolitan Manila Development Authority (MMDA) for providing us with access to their traffic incident reports. Part 1 of our series is here.
We’re diving back into the full set of 90,258 traffic incidents recorded by the MMDA in 2014. Last time, we looked at when you’re most likely to die on the road (2am) and the vehicles most vulnerable to crashes (motorcycles & bicycles). In this story, we’ll explore the most dangerous streets and cities in Metro Manila. We’re defining “dangerous accidents” as accidents where people are injured or killed, as opposed to accidents where only property is damaged.
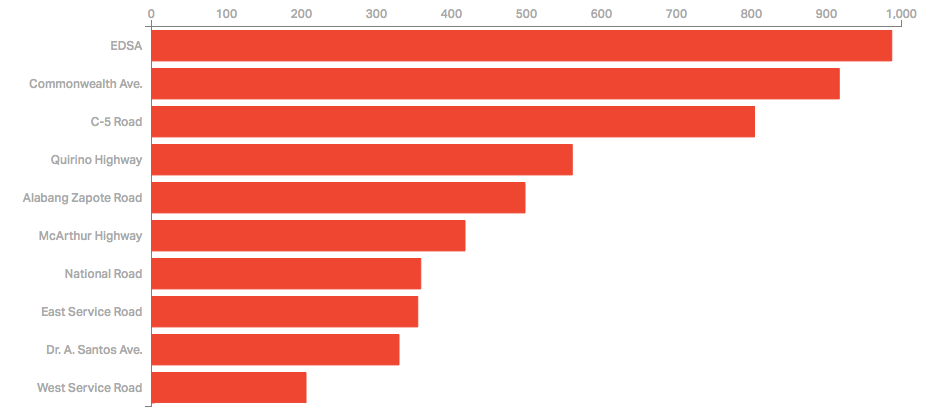
The Most Dangerous Streets in Metro Manila
On which streets in Metro Manila were the most people injured or killed in traffic incidents?
EDSA reports highest traffic-related casualties overall
There were nearly 1,000 people killed or injured in traffic-related incidents on EDSA in 2014 -- more than on any other Metro Manila road in the same year. The street with the second most casualties was Commonwealth Avenue, already dubbed a “killer highway” by the Philippine media, with over 900 casualties. C-5 came in third with about 800 casualties.
To better measure how accident-prone a street is, we would ideally normalize the number of crashes by the number of vehicles that pass along the road on a regular basis. For example, say you have two roads-- Road A and Road B. Every day, 1,000 vehicles pass through Road A, while around 100 vehicles pass through Road B. Both roads report around 10 road accidents every day. Which is more accident-prone?
Of course, some streets may have more accidents because they also have higher traffic volume. If Road A and Road B each experience 10 crashes a day, but 1000 cars pass through Road A while only 100 cars pass through Road B, the more “crash-prone” street is actually Road B.
To conduct a similar normalization of Metro Manila’s streets, we would need data on the vehicle volume of all Metro Manila’s roads. If anybody out there has access to this data, let us know! We do hope that government agencies such as the MMDA, Department of Transportation and Communication (DOTC), and Department of Public Works and Highways (DPWH) will continue working towards making detailed traffic data open and accessible to all.
The most dangerous streets for pedestrians, drivers, and passengers are EDSA, C-5, and Commonwealth Ave
Our team drilled further into the list of Metro Manila’s casualty-prone streets to see which streets are more dangerous specifically for different types of road users such as pedestrians, passengers, and drivers.
Road Casualties 2014
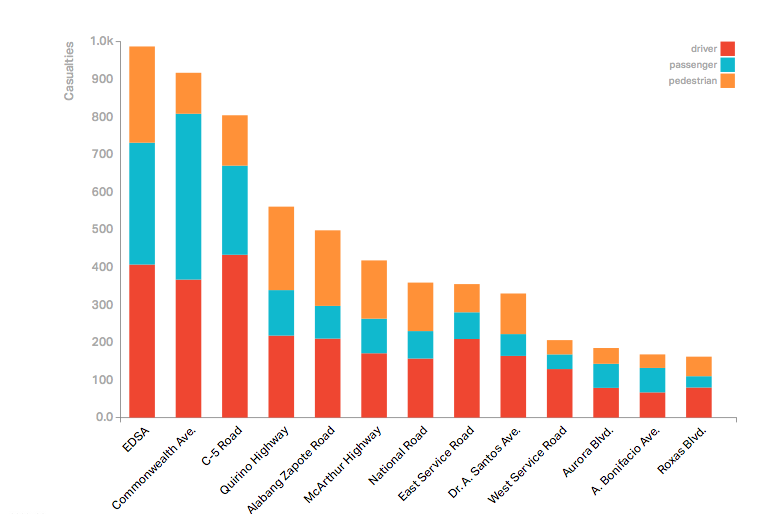
First, our definitions. The MMDA system counts as "drivers" people driving four-wheeled motor vehicles as well as riders of motorcycles, bicycles, and tricycles. We refer to anyone injured or killed in a traffic accident as a “casualty.” A “pedestrian" is someone who is on foot and not riding any vehicle.
For pedestrians, EDSA was still the worst street to be on in 2014. More than 250 pedestrians were either killed or injured while walking along it. Not far behind with over 200 pedestrian casualties was Quirino Highway, which was also the only road on which pedestrian casualties outnumbered both drivers and passengers.
For passengers, Commonwealth Avenue was the most dangerous road in 2014, and the only road for which passenger casualties outnumbered driver casualties and pedestrian casualties. Nearly 450 passengers were killed or injured on this highway last year. At second and third place were EDSA and C-5 with around 300 and almost 250 passenger casualties, respectively.
C-5 topped the list of streets with the highest driver casualties, with almost 450 drivers killed or injured. This street also had the highest ratio of driver casualties compared to pedestrians and passengers. Over 54% percent of the people killed or hurt on C-5 were drivers.
The top 10 most dangerous streets account for 26% of all road casualties.
Top 10 Dangerous Streets
Taken together, the top 10 most crash-prone streets accounted for 5,435 casualties, or 25 percent of the 21,342 people killed or injured on Metro Manila roads in 2014. If you can avoid being on these streets, your odds of being in a dangerous accident go down drastically. Unfortunately, these streets are all difficult to avoid. They’re among Metro Manila’s busiest thoroughfares, typically wider and longer than other roads, and therefore also better monitored by traffic personnel and police.
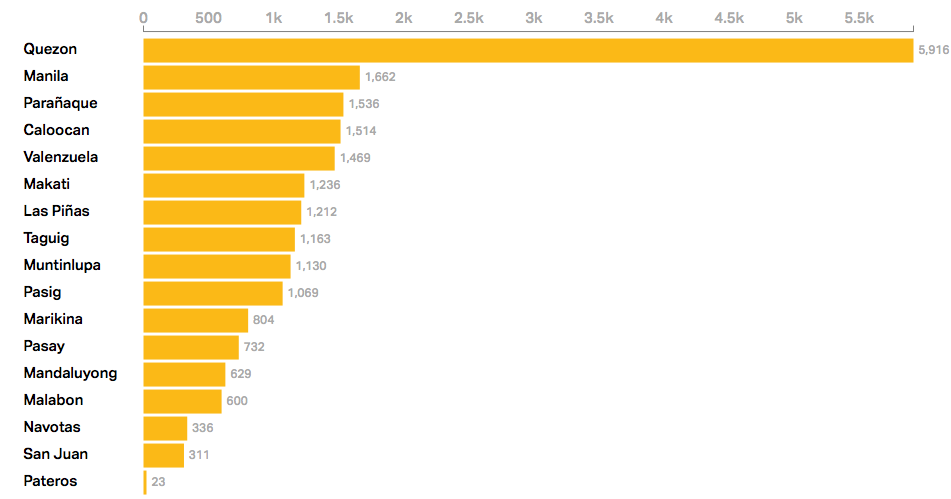
The Cities with the Most Dangerous Roads
Our team did a similar analysis of how Metro Manila’s 17 cities compare in terms of traffic-related casualties. Overall, Quezon City recorded the most traffic-related casualties for every type of road user, but it is also the most populous and largest city in Metro Manila.
Click to explore road casualties for each city and each type of road user:
Total Number of Injuries and Deaths
Controlling for population, Parañaque was the city with the most dangerous roads
To control for population, we checked how many traffic-related deaths and injuries are recorded per 10,000 residents in a city. Luckily, population information is easily available online for all Metro Manila’s cities, and we were able to normalize the number of incidents by using “casualties per 10,000 residents” as our metric.
Number of Injuries and Deaths per 10,000 Residents
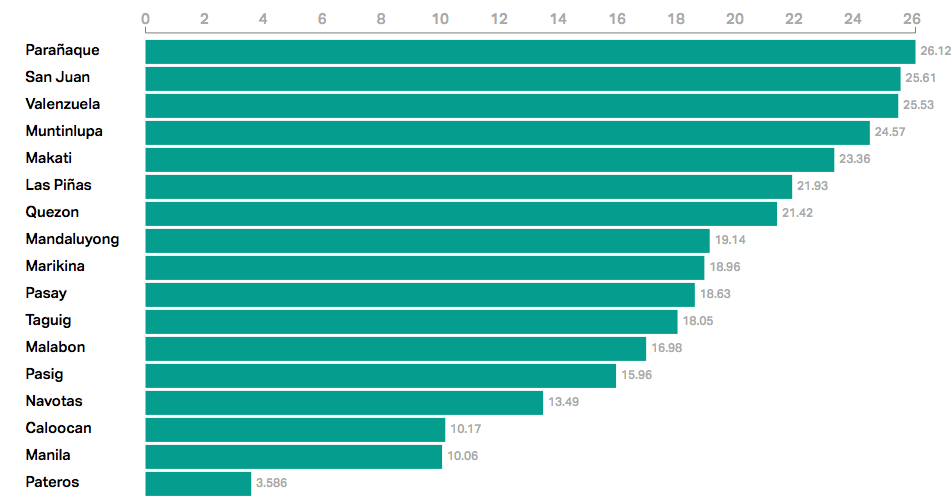
In 2014, Parañaque, San Juan, and Valenzuela all reported more than 25 traffic-related casualties per 10,000 residents, taking the top three spots on the list. Meanwhile, the three cities with the lowest numbers of traffic-related casualties were Caloocan and Manila, each with around 10 casualties per 10,000 residents, and Pateros with fewer than five.
Drilling down into the data as we did with streets, the ranking of cities changes when we focus separately on pedestrian, driver, and passenger casualties. Key takeaways:
- Valenzuela was the most dangerous city for pedestrians, passengers
- Parañaque was the most dangerous city for drivers
If you’re on foot, Valenzuela is slightly more dangerous than Parañaque, with over 8 pedestrians killed or injured per 10,000 residents compared to just over 7 in Parañaque. If you’re trying to decide whether to ride or walk, keep in mind that Pasig City and Pateros were the only two cities where pedestrian casualties outnumbered drivers and passengers. Marikina City, which has been awarded in the past for its walkable sidewalks program, was Metro Manila’s second safest city for pedestrians.
Parañaque City reported the highest number of driver casualties, with 12 drivers killed or injured for every 10,000 residents. Valenzuela, San Juan, and Quezon City nearly tied for the highest rate of passenger casualties, each with around 7 per 10,000 residents.
Questions, questions...
The Thinking Machines team had a few questions we weren't able to answer to our own satisfication. If anyone out there has the answers, we'd sure love to meet you.
- Why are some streets and cities more dangerous to pedestrians than others? Are more pedestrians getting hurt on streets without sidewalks, crosswalks, and waiting sheds, or conversely, are fewer getting hurt on streets that do have these features?
- Why are some streets and cities more dangerous to drivers than others? Take C-5 for example, where a huge majority of casualties are drivers. Do more motorcycles and private cars -- vehicles that are driven by single drivers and with fewer passengers -- pass on C-5 than on other streets?
- Why is Commonwealth Avenue especially dangerous to passengers? Are there simply more passenger-vehicles, such as jeepneys and buses, that pass along Commonwealth relative to other vehicles?
- How can information about what road users are more vulnerable on certain roads and cities help traffic management authorities better address road safety in those cities and roads?
In our next article, we'll look at how traffic accidents have changed in the last 10 years and answer some questions about how much more deadly our streets have gotten.
Enjoyed this data story? Want to supercharge your content marketing strategy with data? Send us an email at [email protected]
If you have any interesting questions about this dataset, tweet us @thinkdatasci to get some answers!