INTERACTIVE: How voter turnout has changed in 1,611 Philippine towns & cities since 2007
April 18, 2016
Using data provided to us by the Philippine Center for Investigative Journalism and sourced from COMELEC, we produced this interactive visualization of how the number of voters has changed in 1,611 Philippine cities and towns over the past three elections.*
Each line in the chart represents one city or municipality in the Philippines. In most towns, the number of voters increased over the past three elections by an average of 14.5% from 2007 to 2010, and an average of 22.5% from 2007 to 2013.
It’s not surprising for voter turnout to increase along with voting-age population, represented on our chart by the green dotted line. But what’s unusual and interesting is when the number of voters in a town or city changes dramatically from one election to the next, to a degree more extreme than can probably be caused by demographic or population change.
One town in Mindanao, for example, had 10,051 voters in the 2007 elections. That number plummeted to 1,337 in 2010, and then rose again to 3,045 in 2013. The town is unusual not only because it lost voters over three elections (which can be said about just 6% of the towns and cities in the Philippines), but also because of the magnitude of that loss. Another town in Central Luzon showed a remarkably huge gain in voters over three elections. From 30,306 voters in 2007, the town reached 40,830 voters in 2010, and then tripled to 126,680 voters in 2013.
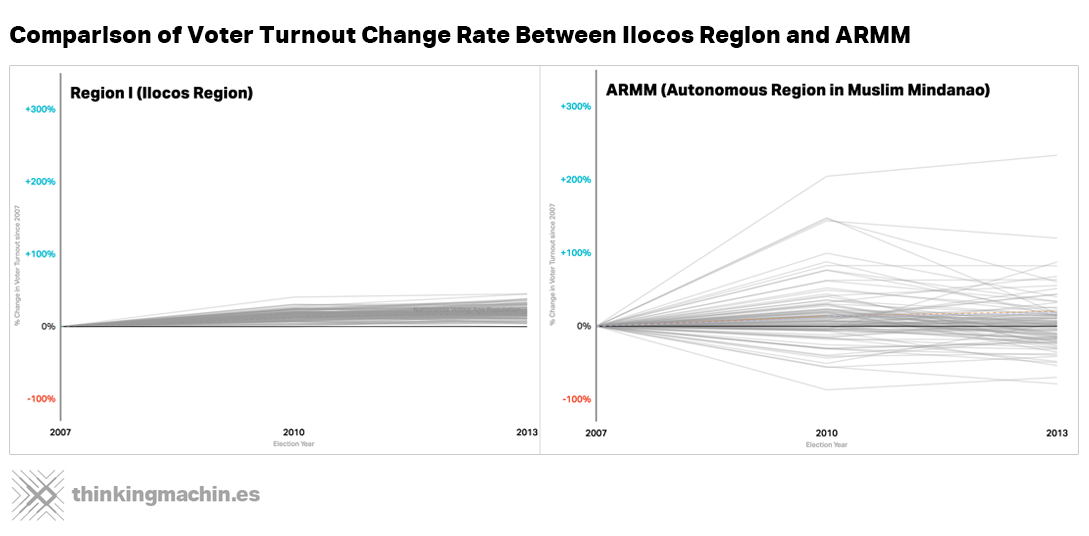
A lot of datasets have outliers. But insights emerge when you can spot patterns in when, where, and how these outliers occur. Our interactive visualization shows that cities and towns with extreme changes in voter turnout were found more frequently in some regions and provinces than in others. For example, compare the charts representing the Ilocos Region and the Autonomous Region of Muslim Mindanao (ARMM). On average, towns and cities in ARMM were the farthest away from the average change rate for all cities and towns, while those in the Ilocos Region were the closest. The tighly-packed, predictably rising lines in the chart representing Ilocos Region look very different from the chaotically rising and falling lines in the chart representing ARMM.
While this data visualization shows what changes took place and where, it can’t explain why these changes happened. In places where there were huge increases in the number of voters, there could have been an influx of voting-age residents to the area from elsewhere, greater motivation among residents to register and vote, or even vote padding. In places where the number of voters went down sharply, there could have been an exodus of voting-age residents, a decrease in the number of people willing to vote (perhaps because of election violence or intimidation), or even previous vote padding practices that have since stopped. Some of the changes could have even been caused by clerical errors, even though we assume that the data provided by COMELEC to be correct and true.
Ultimately, these hypotheses need to be tested with on-ground investigation and verification. In the meantime, we hope this visualization can identify places where voting patterns deserve a closer look this coming election.
You can use the drop-down menus to view patterns per island group, region, and province.
For the best experience, please view this post on your computer.
Find your area:
Enjoyed this data story? Want to supercharge your content marketing strategy with data? Send us an email at [email protected]
* There are a total of 1,490 municipalities and 144 cities in the Philippines, but our dataset was missing figures for 23 towns.
If you have any questions about this dataset, tweet us at @thinkdatasci to get some answers!